Executive Summary
- EdgeAtlas identified a historically negative skew with elevated downside risk for Jacobs Solutions Inc. (J) on 2026-06-08.
- The analysis used 36 historical matches across 36 unique symbols.
- Similar setups finished positive 41.7% of the time over the next 5 trading days.
- Average historical return was -1.4%; median historical return was -0.6%.
- The worst historical outcome was -28.7%, making tail risk a key part of the setup.
- The most important observation is that similar setups historically leaned negative over 5 trading days, suggesting caution toward bullish continuation assumptions.
Quick Answer
EdgeAtlas found a historically negative setup for Jacobs Solutions Inc. (J) on 2026-06-08. Across 36 similar historical setups, only 41.7% finished positive over the next 5 trading days, with an average return of -1.4% and a median return of -0.6%.
The setup had high reliability and strong match quality, based on a median overall match score of 5/5 and a median shape similarity score of 5/5. That means the historical analogs were structurally close to the current market pattern, not just loosely similar price moves.
The useful takeaway is not a prediction. It is historical context. Similar market structures have produced a clear outcome tendency, but the distribution also shows meaningful tail risk that traders would need to account for.
What EdgeAtlas Observed
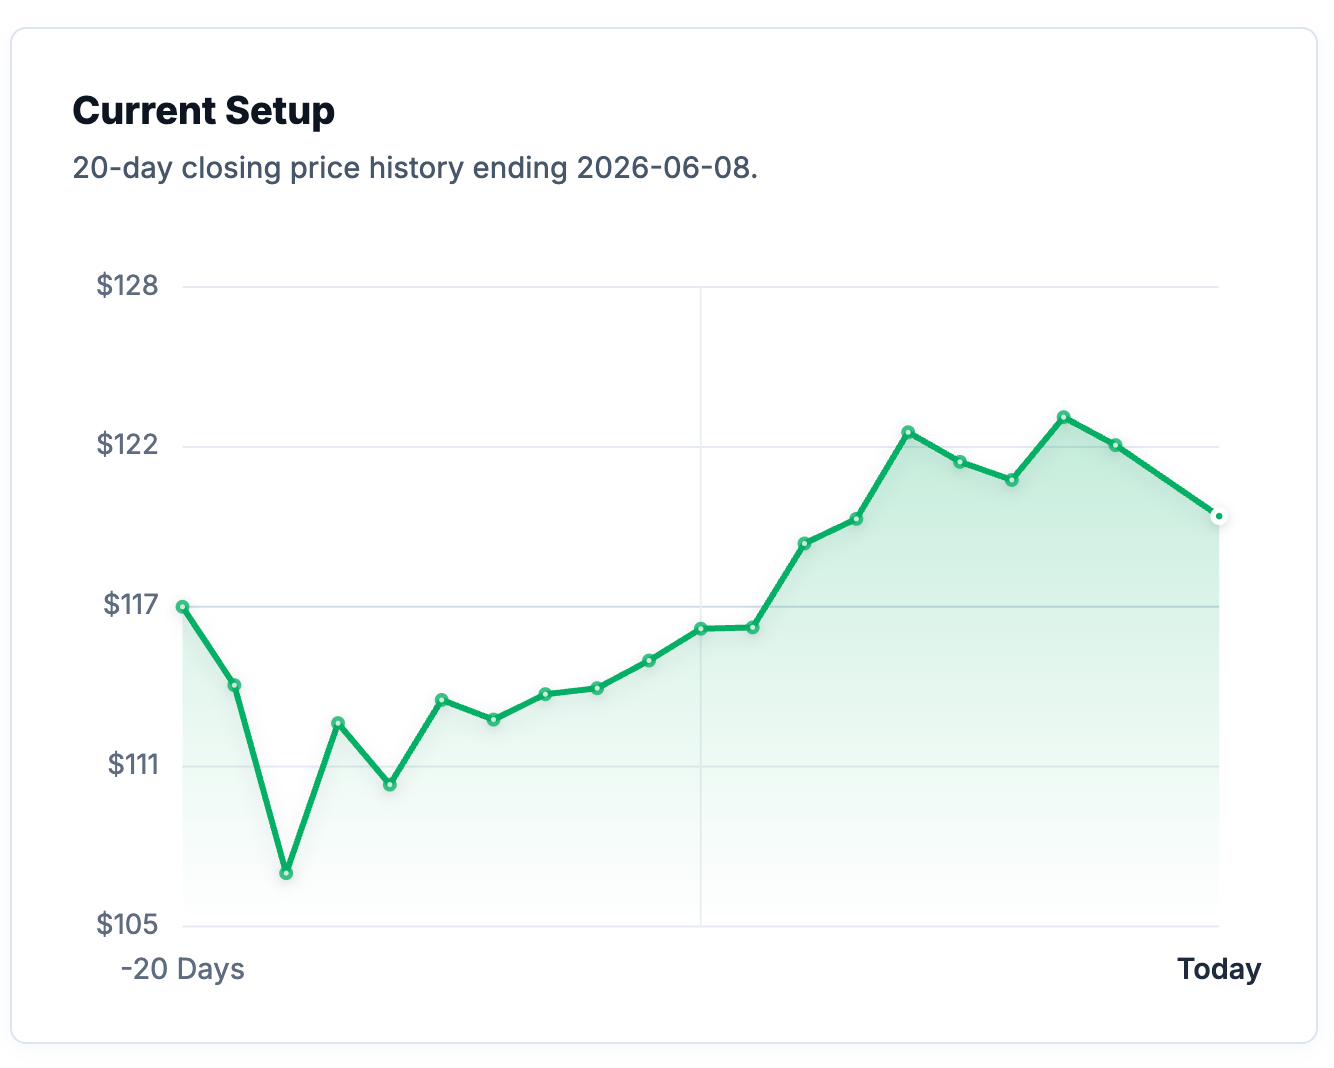
EdgeAtlas compared the current 20-day setup in Jacobs Solutions Inc. (J) against decades of market history across thousands of stocks. The system found 36 statistically similar historical setups and then measured what happened over the following 5 trading days.
The current setup was selected because the price structure, trend behavior, range position, volatility profile, and risk characteristics closely resembled prior market conditions. The historical matches were not limited to J; they came from a broad cross-market set, which helps show whether this type of structure has appeared elsewhere in market history.
For traders, the immediate point is simple: this is a historical stock analysis of similar setups, not a forecast. It shows how prior occurrences behaved, including both the central tendency and the downside tail.
Key Statistics
- Historical Matches: 36
- Positive Return Rate: 41.7%
- Average Return: -1.4%
- Median Return: -0.6%
- Worst Return: -28.7%
- Reliability: high
- Match Quality: strong
The statistics show a setup with bearish moderate historical behavior, moderate consistency, and high tail risk. The match quality was strong, which improves the usefulness of the comparison, but the worst-case outcome still matters because historical similarity does not remove event risk or regime risk.
Understanding The Metrics
Positive Return Rate measures the percentage of historical matches that produced a positive return over the forward analysis window.
Match Quality measures how closely the prior setups resembled the current market structure. It considers shape, trend, volatility, range position, volume, and risk characteristics.
Reliability reflects the quantity, diversity, and consistency of the supporting historical evidence. A high-reliability label means the setup has enough historical depth to be more useful than a thin-sample pattern.
Why This Setup Is Interesting
The main message in this J stock analysis is the gap between ordinary weakness and tail-driven damage. The median outcome was only modestly negative, but the average was worse because a small number of historical cases fell sharply. That makes the setup more dangerous than the headline win rate alone suggests.
The more practical point is the balance between historical tendency and downside exposure. A setup can have a favorable tendency and still demand discipline if the losing tail is large. For Jacobs Solutions Inc. (J), the historical outcome distribution shows that the setup should not be judged by direction alone. The quality of the payoff distribution matters.
This is where historical market patterns become useful. The chart may show a recognizable short-term structure, but the historical record shows how similar structures actually behaved afterward. That helps separate a visually appealing setup from one with a measurable risk profile.
What An Experienced Trader Might Notice
- The positive rate was only 41.7%, so similar setups more often failed to continue higher over the next 5 trading days.
- The median return of -0.6% was manageable, but the average return of -1.4% shows the downside cases pulled the distribution lower.
- The worst historical outcome was -28.7%, making tail risk the defining feature of the setup.
- The setup is less about frequent small losses and more about the possibility that one bad analogue can dominate the risk profile.
Cross-Market Context
The strongest cross-market matches included AXON, WYNN, GS, MPWR, CRH, HRL, HPE, STLD. These matches came from different industries and business models, including retail, energy, insurance, utilities, payments, industrial technology, software, financials, and consumer-related names.
That variety matters. Cross-market analysis is useful because similar market structures can appear in unrelated stocks when positioning, volatility, trend repair, and range behavior line up. A dental distribution company and a retailer do not need to share the same fundamentals to share a similar short-term market structure.
For Jacobs Solutions Inc. (J), the cross-market matches suggest the current setup is less about one company-specific story and more about a recurring market behavior pattern. That is one of the advantages of looking beyond single-stock chart history.
Historical Outcome Characteristics
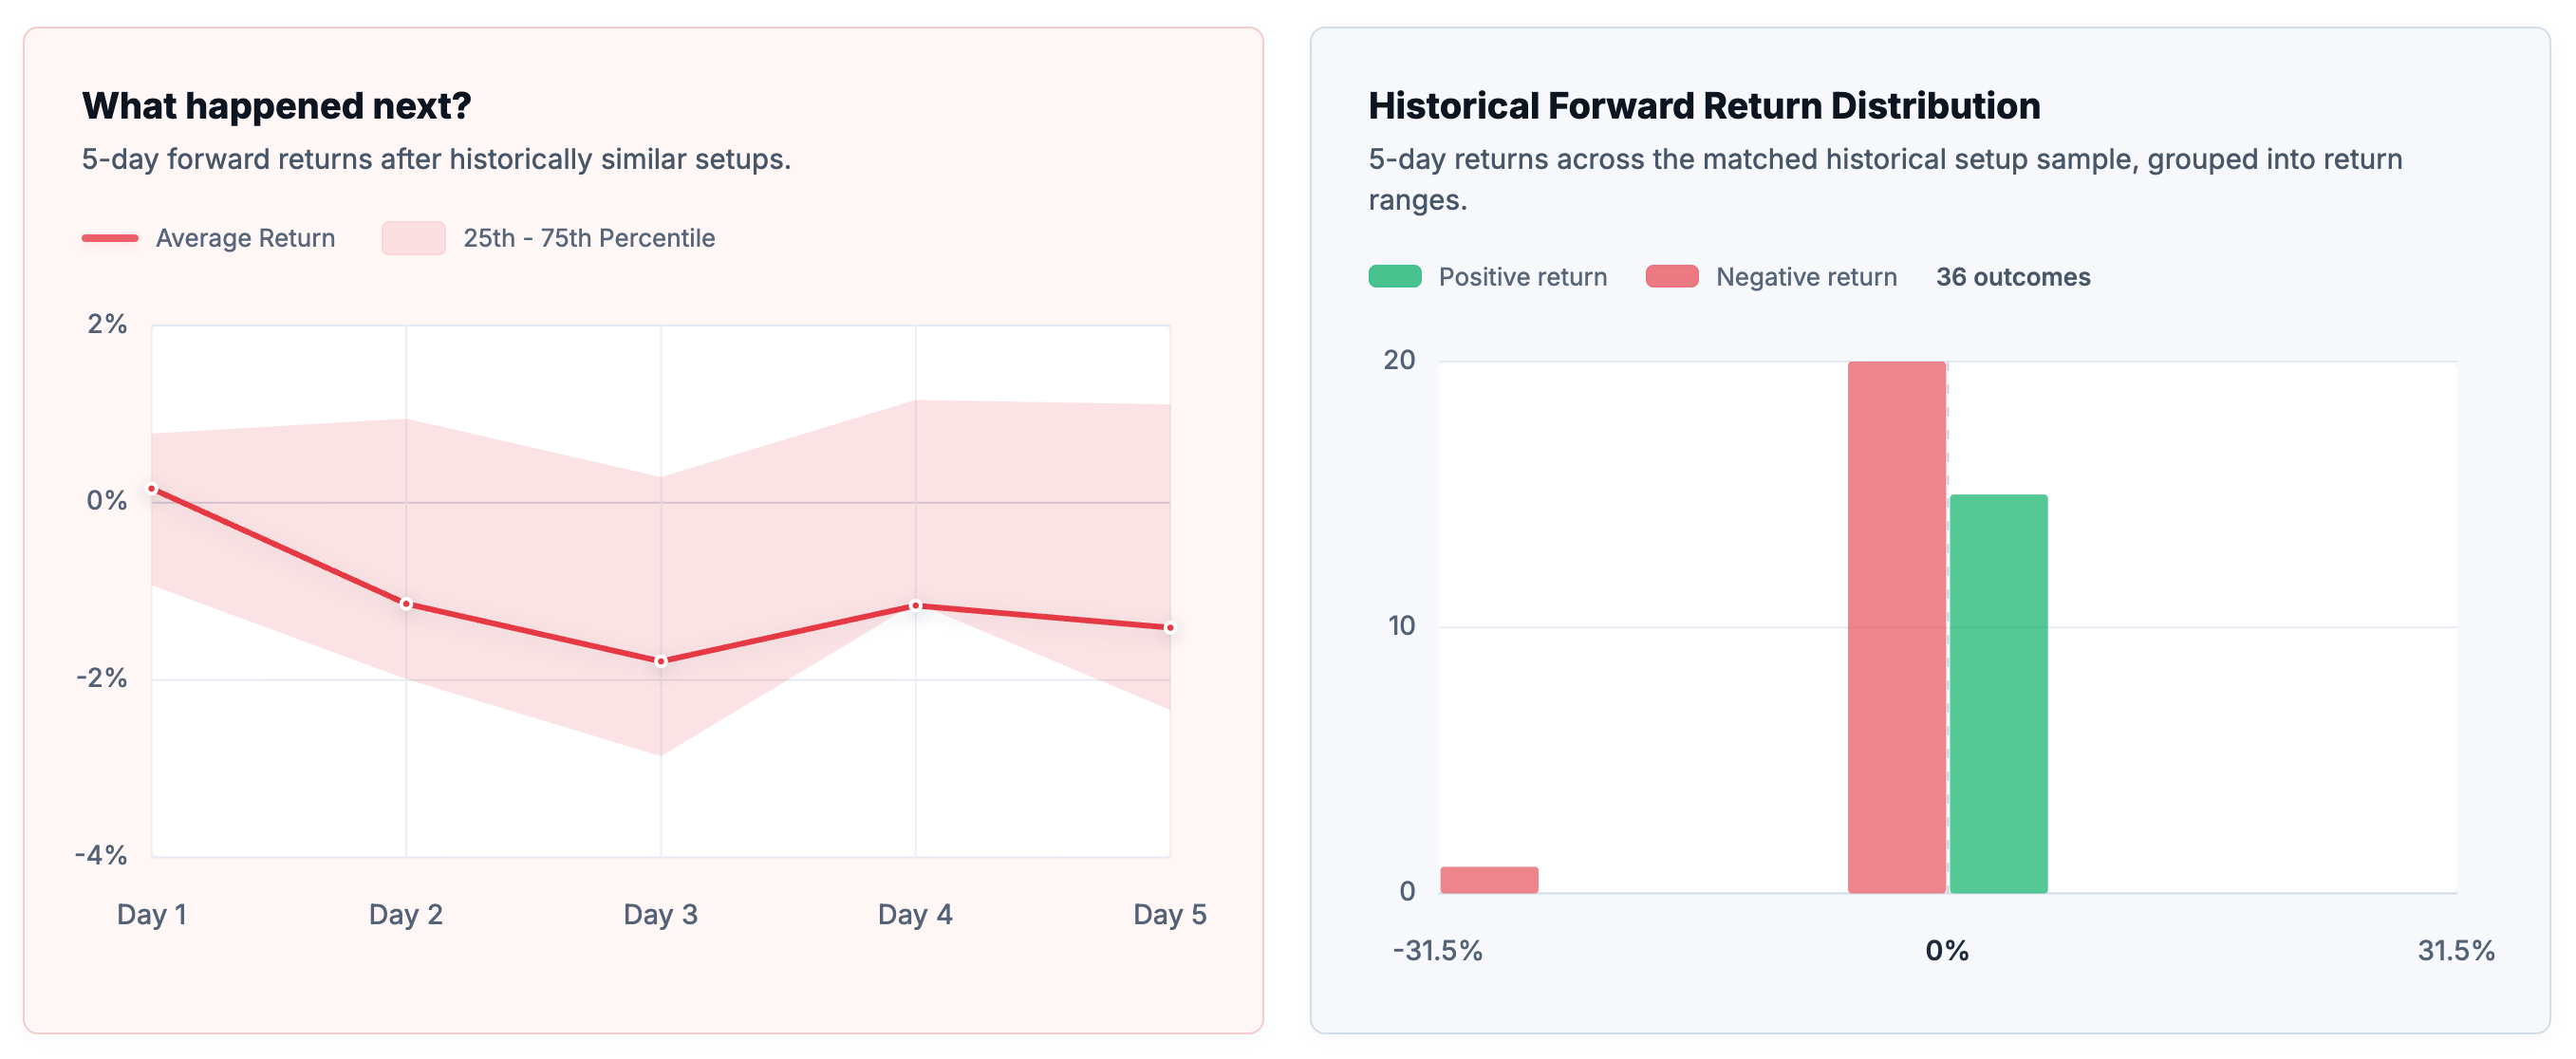
The interquartile band ran from -2.3% to +1.1%, but the lower tail was much more severe than the typical case. The 10th percentile was -5.1%, while the worst historical result reached -28.7%. That is why the downside distribution matters more than the median alone.
The outcome path also showed timing variation. The average return was weaker early in the forward window and became more defined by day four and day five. That means the historical tendency was not always immediate. Some matching setups needed several sessions before the forward outcome became clear.
The limitation is important: even strong historical matches can fail. The presence of a large adverse excursion shows that similar setups sometimes moved sharply against the historical tendency before, during, or after the five-day window.
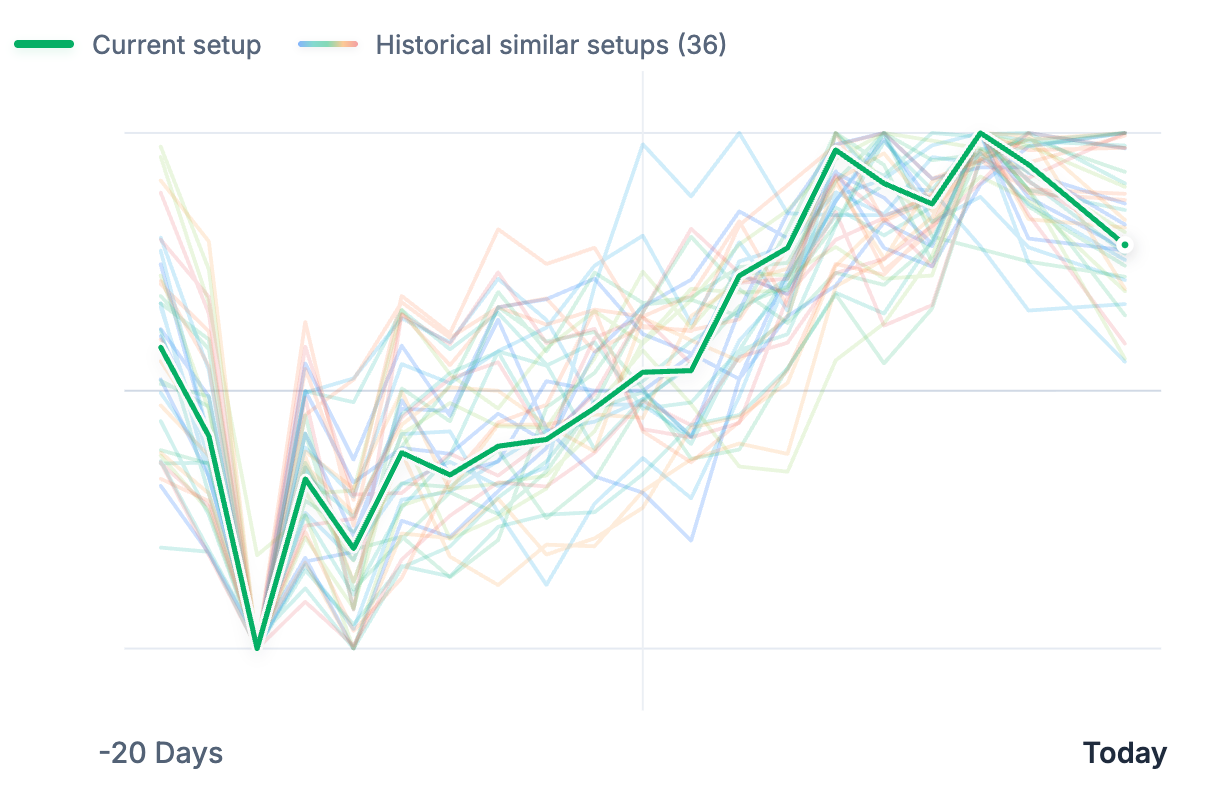
Current Setup vs Historical Matches
Historical Outcome Distribution
Key Takeaways
- Jacobs Solutions Inc. (J) had 36 similar historical setups in the EdgeAtlas database.
- The historical positive return rate was 41.7%, with average and median returns of -1.4% and -0.6%.
- Match quality was strong, with a median overall score of 5/5.
- The worst historical outcome was -28.7%, so the tail risk should not be ignored.
- The setup is best read as historical context, not as a directional forecast.
Frequently Asked Questions
What did EdgeAtlas find?
EdgeAtlas found 36 historically similar setups for Jacobs Solutions Inc. (J) as of 2026-06-08. The setup showed historically negative skew with elevated downside risk over the next 5 trading days.
How many similar setups were found historically?
EdgeAtlas found 36 usable historical matches across 36 unique symbols.
What were the typical historical outcomes?
The average historical return was -1.4%, and the median historical return was -0.6% over the next 5 trading days.
What was the worst historical outcome?
The worst historical outcome was -28.7% over the forward analysis window.
Why were matches found in different stocks?
Similar price structures can appear across unrelated stocks when trend, volatility, range position, volume, and risk conditions align. Cross-market matches help identify recurring market behavior that may not be visible from single-stock history alone.
How does EdgeAtlas identify similar setups?
EdgeAtlas compares the current market structure against historical setups using price shape, trend behavior, volatility, range position, volume behavior, and risk characteristics.
Does this predict future performance?
No.
Historical similarity does not guarantee future outcomes.
The analysis describes what happened after similar historical market conditions, not what will happen next.
Related Research Topics
- Understanding Historical Pattern Matching
- Cross-Market Analog Analysis
- Win Rate vs Outcome Distribution
- Reliability vs Tail Risk
- Historical Outcome Distributions
Who May Find This Research Useful
This research may be useful for traders studying historical market behavior, investors researching J stock analysis, analysts comparing similar historical setups, and market participants interested in cross-market matches and historical outcome distributions.
Methodology Note
EdgeAtlas does not forecast future prices.
Instead, it searches decades of market history across thousands of stocks to identify statistically similar market conditions and analyze what happened afterward.
The results presented here describe historical outcomes, not predictions.
EdgeAtlas compares the current market structure against decades of historical data across thousands of stocks. Rather than forecasting prices, it identifies statistically similar historical setups and examines how those situations behaved afterward.
Important Note
Historical outcomes do not guarantee future results.
This research is intended for educational and informational purposes only and should not be considered investment advice.