Executive Summary
- Best Buy Co. (BBY) showed a mild bullish skew after a sharp repricing and partial pullback.
- EdgeAtlas found 128 similar historical setups across 106 unique symbols.
- Similar setups finished positive 58.6% of the time over the next 5 trading days.
- Average return was +0.6%, while median return was +0.6%.
- The key risk was downside tail exposure, with the worst historical outcome at -16.4%.
- The main point is not that BBY was historically bullish. The point is that the historical edge was small while the adverse tail was large.
Quick Answer
EdgeAtlas found that Best Buy Co. (BBY) had a mild bullish historical skew on 2026-06-05. Similar 20-day market structures appeared 128 times historically and finished positive 58.6% of the time over the next 5 trading days.
This BBY stock analysis is useful because the setup was not a simple bullish or bearish case. The historical evidence showed +0.6% average return and +0.6% median return, but the worst historical outcome was -16.4%.
The practical lesson is that similar historical setups had a measurable tendency, but the outcome distribution matters more than the headline direction label.
What EdgeAtlas Observed
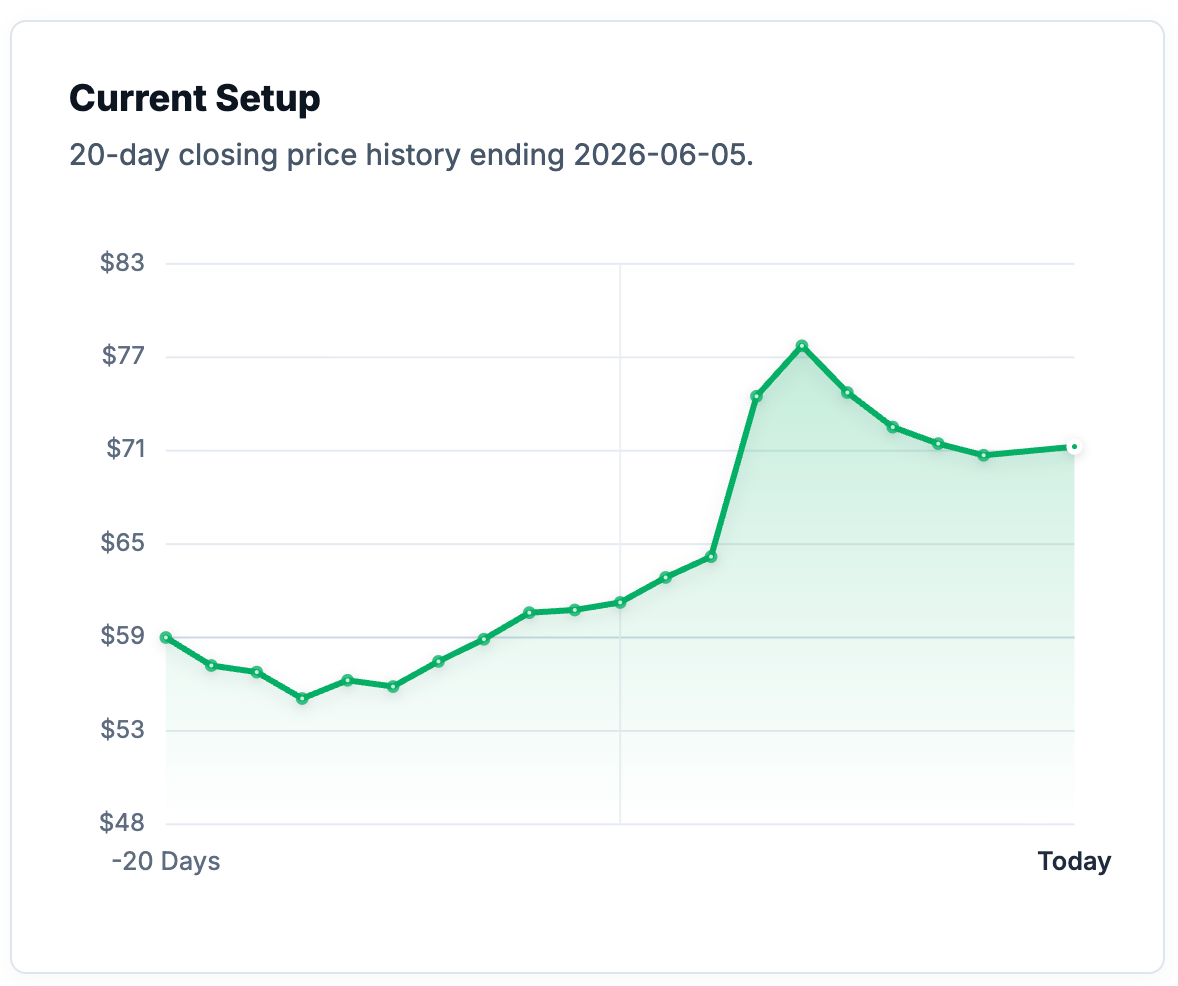
EdgeAtlas identified a current 20-day market structure in Best Buy Co. stock and compared it with historical market patterns across thousands of stocks.
The setup was selected because the historical matches were structurally strong, with a median quality score of 5/5 and median shape score of 5/5. The historical evidence was also diversified across 106 unique symbols.
Traders should immediately understand that this is historical context, not a trade instruction. The value is in seeing the distribution of prior outcomes after similar market conditions.
Key Statistics
- Historical Matches: 128
- Positive Return Rate: 58.6%
- Average Return: +0.6%
- Median Return: +0.6%
- Worst Return: -16.4%
- Reliability: High
- Match Quality: Strong
The statistics show that BBY had mild bullish historical skew. The important interpretation is not just whether the historical average was positive. It is whether the typical outcome, downside tail, and evidence base all tell the same story.
Understanding The Metrics
Positive Return Rate is the percentage of historical matches that produced a positive return over the forward analysis window.
Match Quality measures how closely historical setups resembled the current market structure.
Reliability reflects the quantity, diversity, and consistency of the supporting historical evidence.
Why This Setup Is Interesting
The main point is not that BBY was historically bullish. The point is that the historical edge was small while the adverse tail was large.
The historical outcome distribution shows why this setup deserves a more careful read. Similar setups were positive 58.6% of the time, but the typical gain was not large enough to ignore the downside tail.
The average return was +0.6%, and the median return was +0.6%. That relationship tells us whether the pattern was broadly supported or pulled around by outliers. In this case, the center of the distribution is informative, but the worst-case result remains a major part of the risk profile.
This is the kind of setup where a simple "bullish" label would be too shallow. The historical evidence is useful because it shows what kind of risk traders were dealing with after similar setups.
What An Experienced Trader Might Notice
- The headline positive rate does not fully describe the risk profile.
- The median return gives a better sense of the typical historical outcome than the best cases.
- The worst historical case was much larger than the normal positive outcome.
- The cross-market matches suggest the setup is structural, not purely company-specific.
Cross-Market Context
Best Buy is a consumer electronics retailer, but the closest historical analogs included Arista Networks, A. O. Smith, Intuitive Surgical, Akamai, PG&E, HPE, Dollar Tree, NetApp, Uber, and Ciena. That mix suggests the match is about market structure after sharp repricing, not retail fundamentals alone.
The cross-market matches included ANET, AOS, ISRG, SATS, AKAM, PCG, HPE, DLTR, NTAP, UBER.
The closest analogs included enterprise technology, industrials, medical devices, utilities, consumer retail, data infrastructure, and travel platforms. This is important because unrelated stocks can share similar price behavior when trend, volatility, volume, range position, and risk conditions align.
That is one of the useful differences between cross-market historical analysis and traditional single-stock chart reading. The question is not only whether BBY looks familiar. It is whether similar structures have appeared elsewhere, and what happened afterward.
Historical Outcome Characteristics
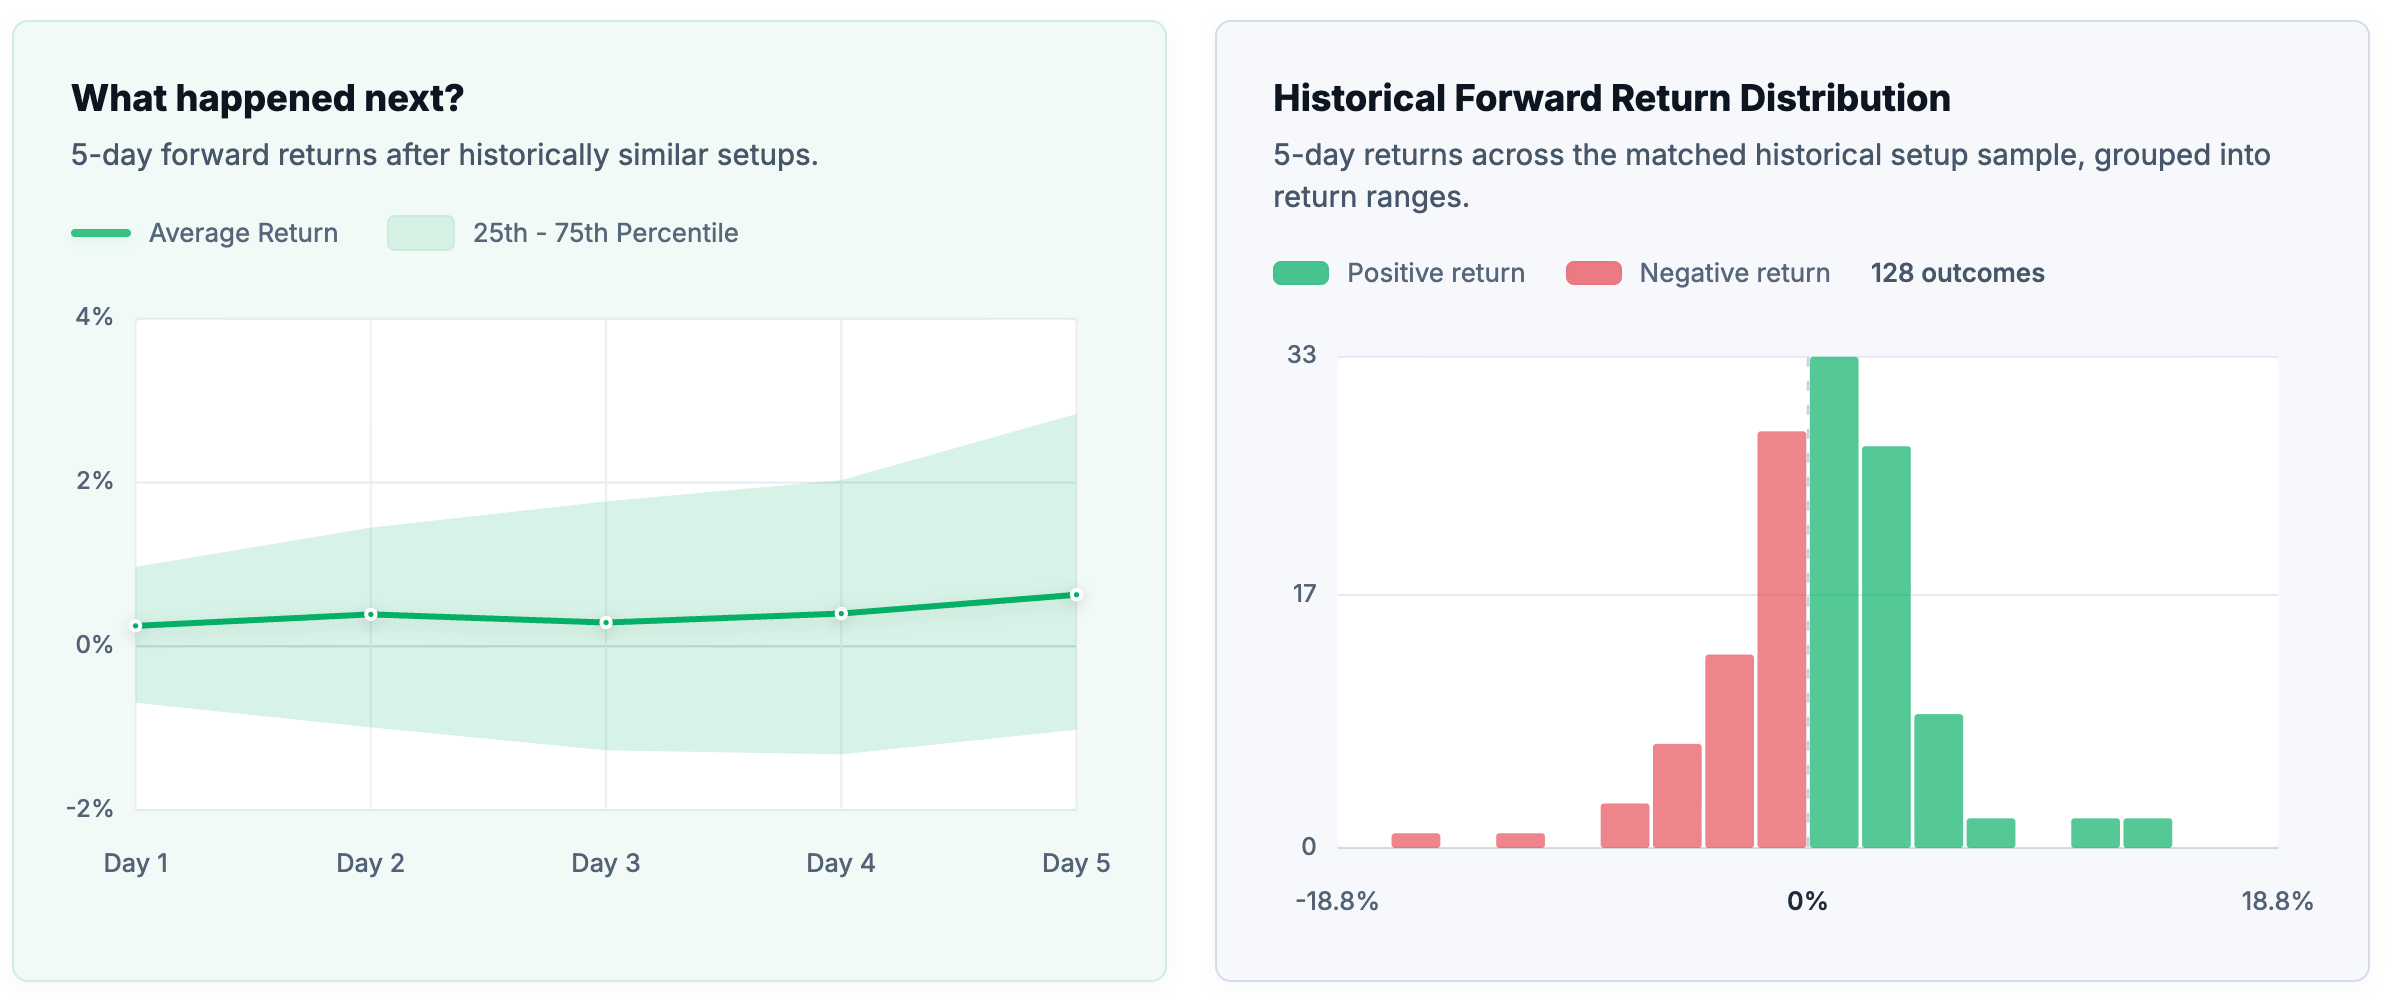
The broad historical outcome range sat between -3.7% and +4.4%. Average return was +0.6%, compared with a median return of +0.6%.
The distribution was moderately consistent, but not clean. The 25th percentile was -1.0%, the median was +0.6%, and the 75th percentile was +2.8%. The 10th to 90th percentile range ran from -3.7% to +4.4%.
Tail risk was the main limitation. The worst historical return was -16.4%, and maximum adverse excursion reached -17.5%. That means adverse movement occasionally became much larger than the typical historical gain.
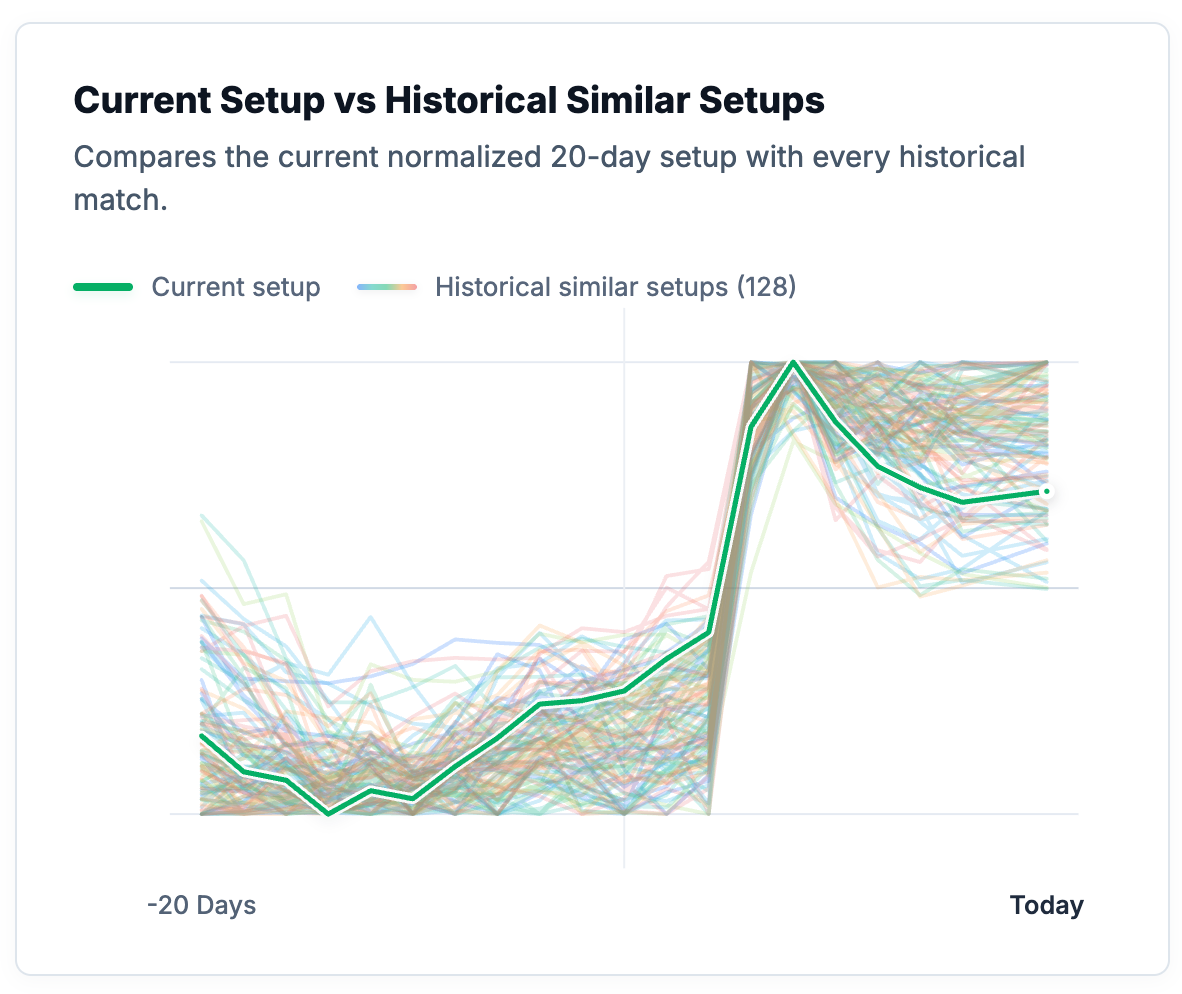
Current Setup vs Historical Matches
Historical Outcome Distribution
Key Takeaways
- BBY had mild bullish historical skew across similar historical setups.
- The evidence base included 128 matches across 106 unique symbols.
- The typical historical outcome was +0.6% over 5 trading days.
- The worst historical case was -16.4%, making tail risk central to the interpretation.
- The cross-market matches suggest this was a structural market pattern rather than a narrow company-specific setup.
Frequently Asked Questions
What did EdgeAtlas find?
EdgeAtlas found that Best Buy Co. (BBY) had mild bullish historical skew based on similar 20-day historical market structures.
How many similar setups were found historically?
EdgeAtlas found 128 similar historical setups across 106 unique symbols.
What were the typical historical outcomes?
Similar setups produced an average 5-day return of +0.6% and a median return of +0.6%.
What was the worst historical outcome?
The worst historical 5-day outcome was -16.4%.
Why were matches found in different stocks?
EdgeAtlas compares market structures across thousands of stocks because similar price behavior can appear across unrelated sectors when trend, volatility, risk, volume, and positioning conditions align.
How does EdgeAtlas identify similar setups?
EdgeAtlas compares the current market structure with historical setups using shape, trend, volatility, risk, volume, and range-position characteristics.
Does this predict future performance?
No. Historical similarity does not guarantee future outcomes. The analysis describes what happened after similar historical market conditions, not what will happen next.
Related Research Topics
- Historical Outcome Distributions
- Cross-Market Analog Analysis
- Win Rate vs Payoff Quality
- Tail Risk After Similar Setups
- How EdgeAtlas Measures Similarity
Who May Find This Research Useful
This research may be useful for traders studying historical market behavior, investors researching BBY stock analysis, analysts comparing historical market setups, and market participants interested in cross-market matches.
Methodology Note
EdgeAtlas does not forecast future prices.
Instead, it searches decades of market history across thousands of stocks to identify statistically similar market conditions and analyze what happened afterward.
The results presented here describe historical outcomes, not predictions.
EdgeAtlas compares the current market structure against decades of historical data across thousands of stocks. Rather than forecasting prices, it identifies statistically similar historical setups and examines how those situations behaved afterward.
Important Note
Historical outcomes do not guarantee future results.
This research is intended for educational and informational purposes only and should not be considered investment advice.