Executive Summary
- Dollar Tree (DLTR) showed a mild bullish historical skew after a sharp 20-day repricing.
- EdgeAtlas found 174 similar historical setups across 137 unique symbols.
- Similar setups finished positive 58.6% of the time over the next 5 trading days.
- Average return was +1.0%, while median return was +0.5%.
- The main risk was downside tail exposure, with the worst historical outcome at -10.4%.
- The most important observation is that the evidence base was broad, but the historical edge was modest.
Quick Answer
EdgeAtlas found that Dollar Tree (DLTR) had a mildly bullish historical setup on 2026-06-04. Similar 20-day market structures appeared 174 times historically and finished positive 58.6% of the time over the next 5 trading days.
The DLTR stock analysis showed a modest positive historical tendency, with an average return of +1.0% and a median return of +0.5%. The evidence base was broad and diversified, which improves confidence in the historical context.
However, this was not a strong bullish setup. The positive skew was mild, and downside tail risk was high, with the weakest prior case falling -10.4% over 5 trading days.
What EdgeAtlas Observed
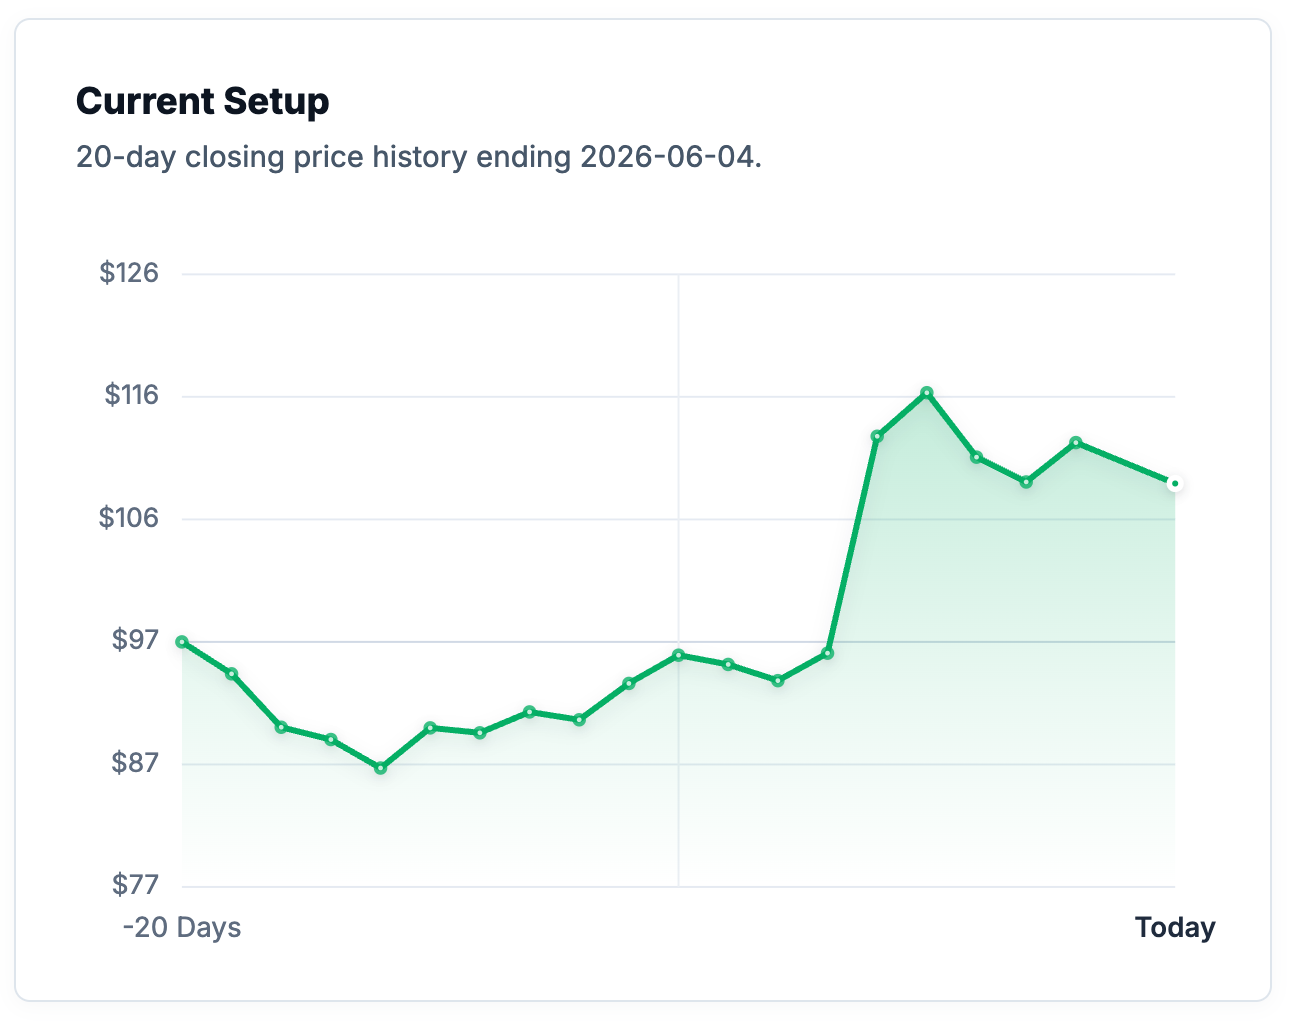
EdgeAtlas identified a recent 20-day structure in Dollar Tree stock that included a sharp upward repricing followed by some short-term instability.
Historically similar setups leaned positive, but not aggressively. The large sample size makes the evidence useful, yet the median outcome was only modestly positive.
The immediate takeaway is that DLTR had broad historical support, but the payoff profile was not especially strong.
Key Statistics
- Historical Matches: 174
- Positive Return Rate: 58.6%
- Average Return: +1.0%
- Median Return: +0.5%
- Worst Return: -10.4%
- Reliability: High
- Match Quality: Strong
The statistics point to a mild positive tendency. The setup was supported by many historical matches, but the median return was small and the downside tail was large.
Understanding The Metrics
Positive Return Rate measures the percentage of historical matches that produced a positive return over the 5-day forward window.
Match Quality measures how closely historical setups resembled the current market structure.
Reliability reflects the quantity, diversity, and consistency of the supporting historical evidence.
Why This Setup Is Interesting
DLTR is interesting because the historical evidence is strong in quantity, but modest in directional strength.
A 174-case sample across 137 unique symbols is unusually broad. That makes the setup more reliable than a small-sample observation. But the actual historical edge was not large. Similar setups finished positive only 58.6% of the time, with a median move of +0.5%.
That creates a useful distinction: reliability of evidence is not the same thing as strength of edge.
The average return was higher than the median, which suggests that stronger upside cases helped lift the average. But the left tail remained meaningful, with the weakest prior outcome at -10.4%.
The setup is therefore not “strongly bullish.” A better description is: broadly observed, mildly constructive, but vulnerable to adverse exceptions.
What An Experienced Trader Might Notice
- The evidence base is large, but the positive return rate is only mildly above 50%.
- The average return is higher than the median, suggesting some upside outliers helped the result.
- The worst downside case is much larger than the typical positive outcome.
- The setup is more useful as historical context than as a clear directional signal.
Cross-Market Context
DLTR matched with historical setups from Coherent, Lumentum, Expedia, Corteva, Salesforce, Williams Companies, Regeneron, Domino’s Pizza, Biogen, Trimble, Booking Holdings, Generac, Akamai, Teradyne, and Intuitive Surgical.
These matches span optical components, software, travel, agriculture, energy infrastructure, biotechnology, restaurants, medical technology, semiconductors, and internet infrastructure.
That variety matters. Dollar Tree is a discount retailer, yet its closest historical analogs were not limited to retail. The setup appears to reflect a broader behavioral structure: a sharp repricing after a prior decline or unstable base, followed by mixed but mildly positive short-term outcomes.
This is where cross-market analysis adds value. It shows that similar market behavior can appear across unrelated sectors when the structure of price, trend, volatility, and risk becomes comparable.
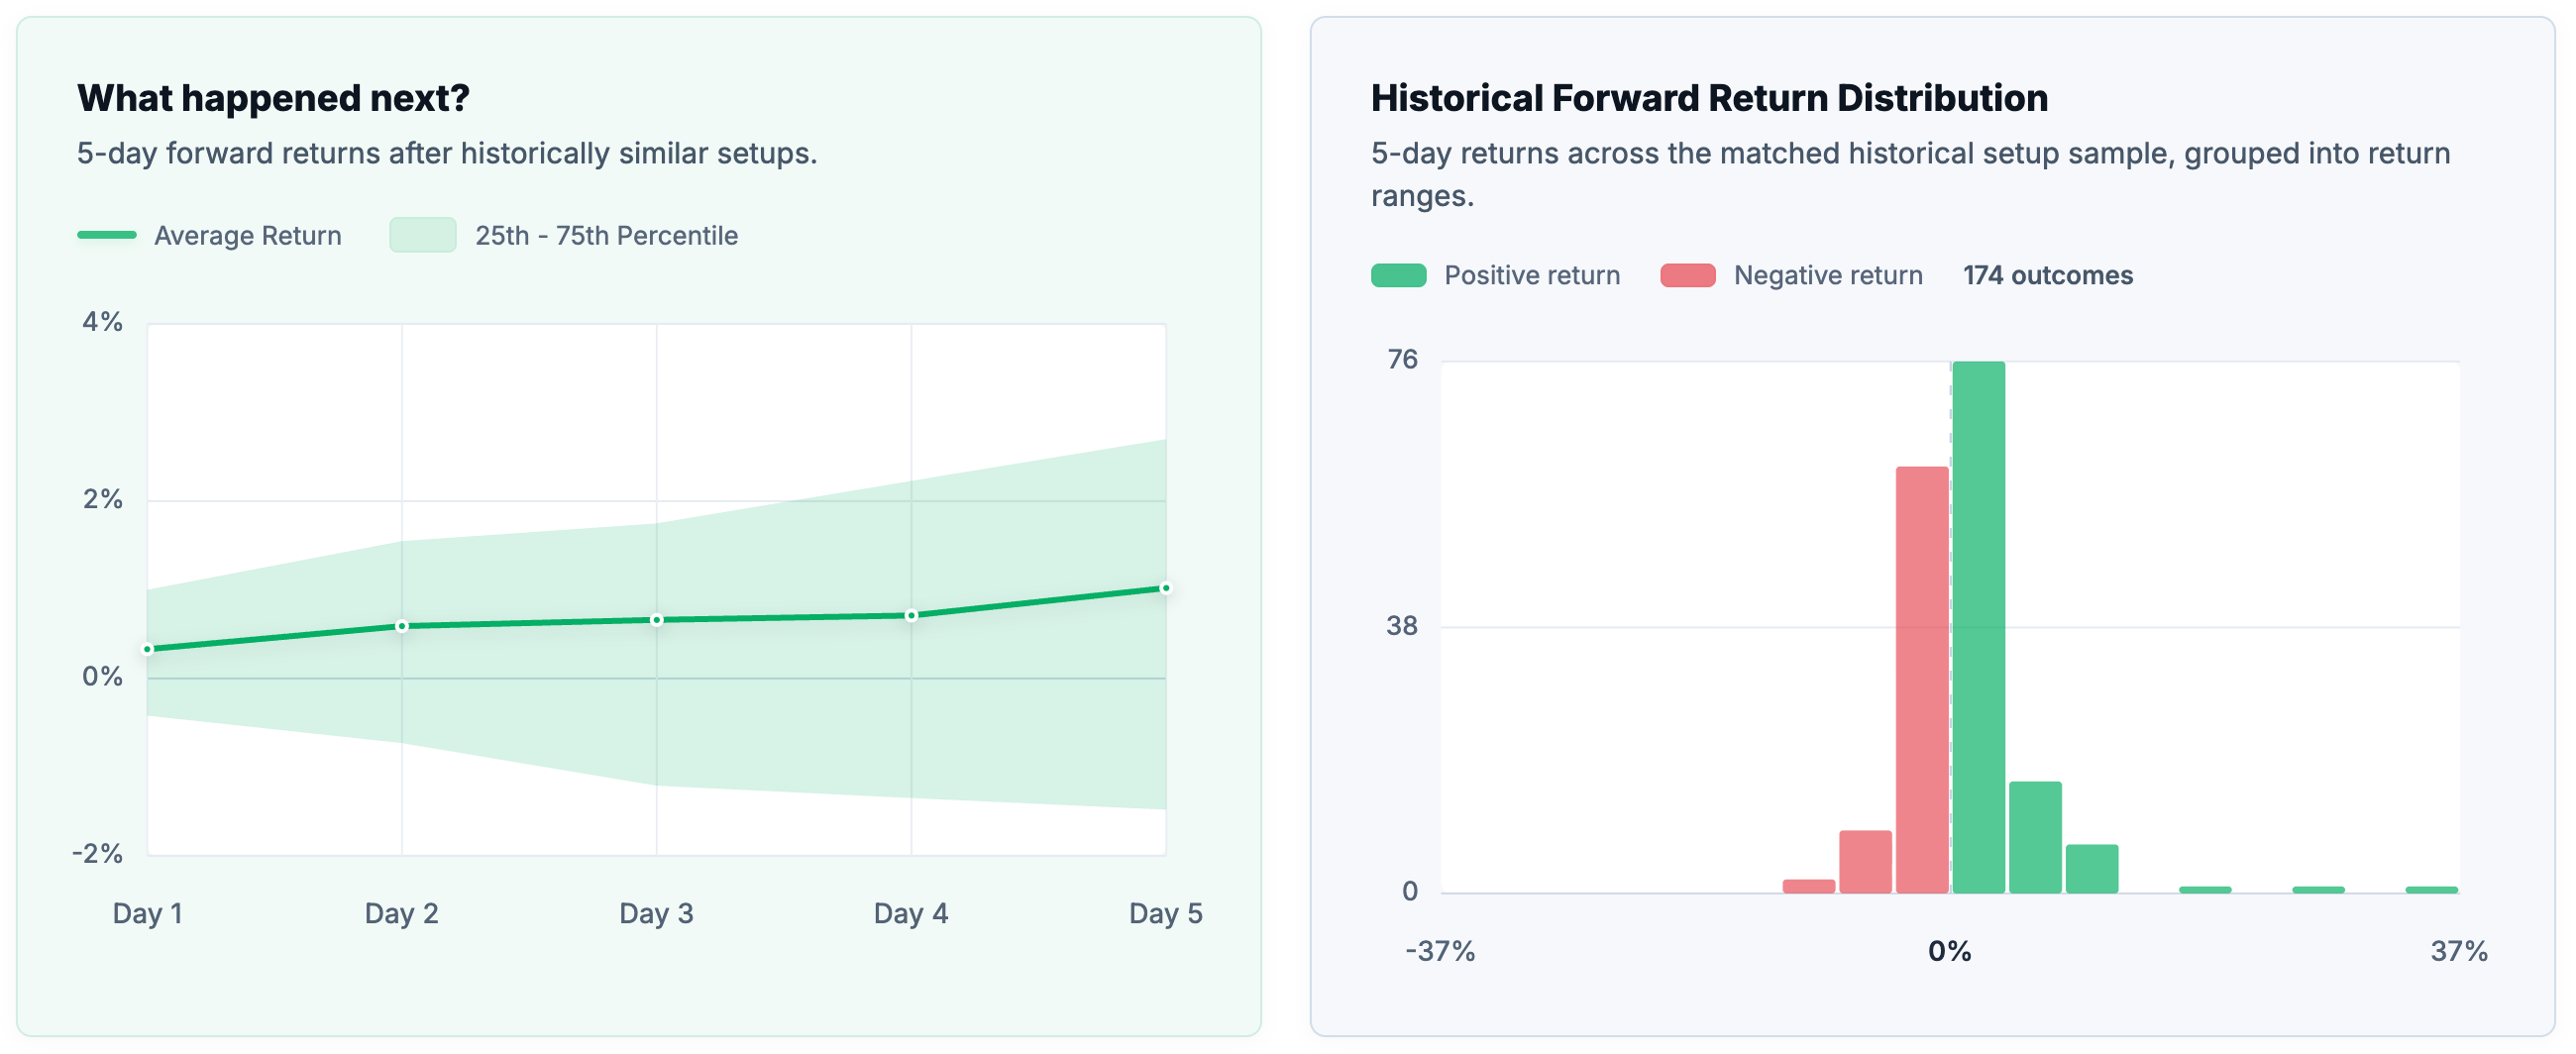
Historical Outcome Characteristics
The historical distribution was mildly constructive but wide.
The 25th percentile was -1.5%, the median was +0.5%, and the 75th percentile was +2.7%. The broad historical outcome range sat between roughly -3.3% and +5.0%.
This tells a balanced story. The center of the distribution leaned positive, but not strongly. Upside outcomes were present, including a best case of +33.5%, but downside exceptions were significant.
The worst 5-day return was -10.4%, and maximum adverse excursion reached -13.2%. That tail risk is large relative to the typical positive return.
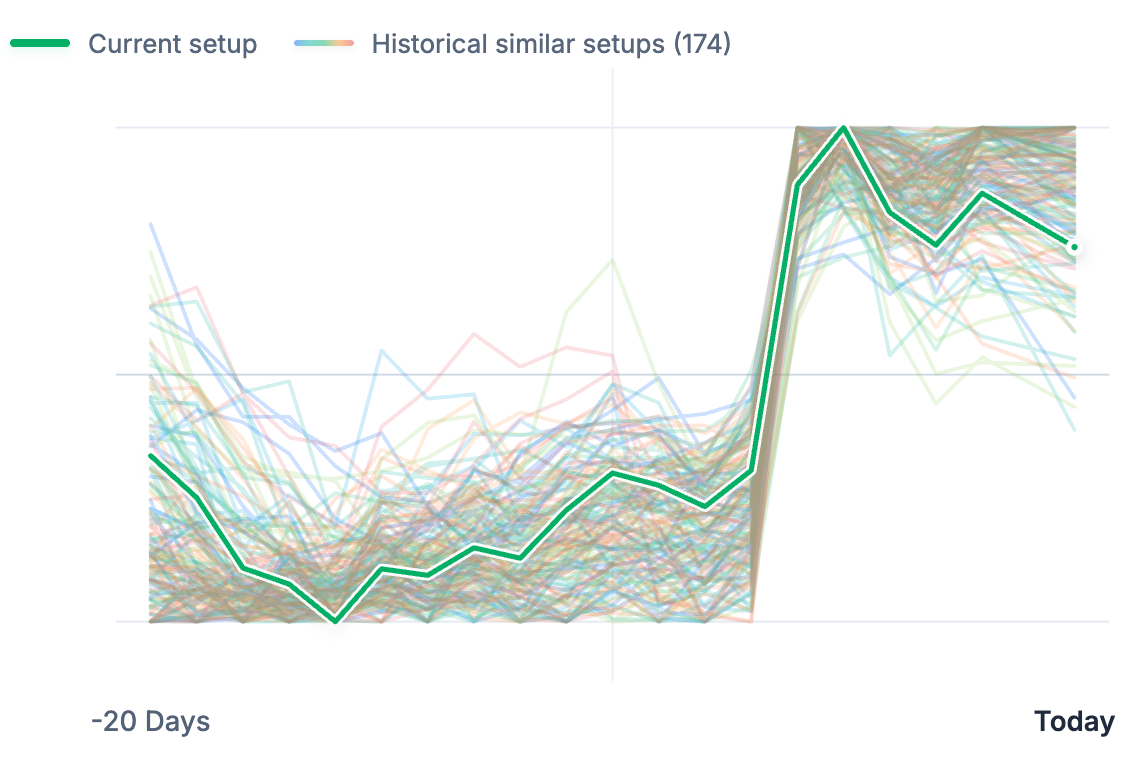
Current Setup vs Historical Matches
Historical Outcome Distribution
Key Takeaways
- DLTR had a mild bullish historical skew, not a strong one.
- The evidence base was broad, with 174 matches across 137 unique symbols.
- The median historical outcome was only +0.5%.
- Downside tail risk was high, with a worst case of -10.4%.
- Cross-market matches appeared across many unrelated sectors.
Frequently Asked Questions
What did EdgeAtlas find?
EdgeAtlas found that Dollar Tree (DLTR) had a mildly bullish historical setup based on similar 20-day market structures.
How many similar setups were found historically?
EdgeAtlas found 174 similar historical setups.
What were the typical historical outcomes?
Similar setups produced an average 5-day return of +1.0% and a median return of +0.5%.
What was the worst historical outcome?
The worst historical 5-day outcome was -10.4%.
Why were matches found in different stocks?
EdgeAtlas compares market structures across thousands of stocks. Similar behavior can appear across unrelated companies when price action, volatility, trend, and risk characteristics align.
How does EdgeAtlas identify similar setups?
EdgeAtlas compares the current 20-day setup against historical market structures using shape, trend, volatility, risk, volume, and positioning characteristics.
Does this predict future performance?
No. Historical similarity does not guarantee future outcomes. The analysis describes what happened after similar historical market conditions, not what will happen next.
Related Research Topics
- Weak Bullish Historical Skew
- Cross-Market Analog Analysis
- Reliability vs Outcome Magnitude
- Historical Outcome Distributions
- Tail Risk After Sharp Repricing
Who May Find This Research Useful
This research may be useful for traders studying historical market behavior, investors researching DLTR stock analysis, analysts comparing historical stock setups, and market participants interested in cross-market analysis.
Methodology Note
EdgeAtlas does not forecast future prices.
Instead, it searches decades of market history across thousands of stocks to identify statistically similar market conditions and analyze what happened afterward.
The results presented here describe historical outcomes, not predictions.
EdgeAtlas compares the current market structure against decades of historical data across thousands of stocks. Rather than forecasting prices, it identifies statistically similar historical setups and examines how those situations behaved afterward.
Important Note
Historical outcomes do not guarantee future results.
This research is intended for educational and informational purposes only and should not be considered investment advice.