Executive Summary
- Datadog (DDOG) showed mixed historical outcomes after a volatile 20-day advance and pullback.
- EdgeAtlas found 65 similar historical setups across 57 unique symbols.
- Similar setups finished positive 47.7% of the time over the next 5 trading days.
- Average return was -0.3%, while median return was -0.2%.
- The main risk was downside tail exposure, with the worst historical outcome at -13.0%.
- The most important observation is that strong structural similarity did not translate into a clear directional edge.
Quick Answer
EdgeAtlas found that Datadog (DDOG) had a historically mixed setup on 2026-06-04. Similar 20-day structures appeared 65 times historically and finished positive only 47.7% of the time over the next 5 trading days.
The DDOG stock analysis showed no clear historical directional edge. Both the average return (-0.3%) and median return (-0.2%) were slightly negative, while the broad outcome range sat between roughly -3.7% and +2.9%.
The key risk was downside tail exposure. The worst historical outcome was -13.0%, and maximum adverse excursion reached -14.0%. This makes DDOG a useful example of why strong pattern similarity is not the same thing as favorable forward behavior.
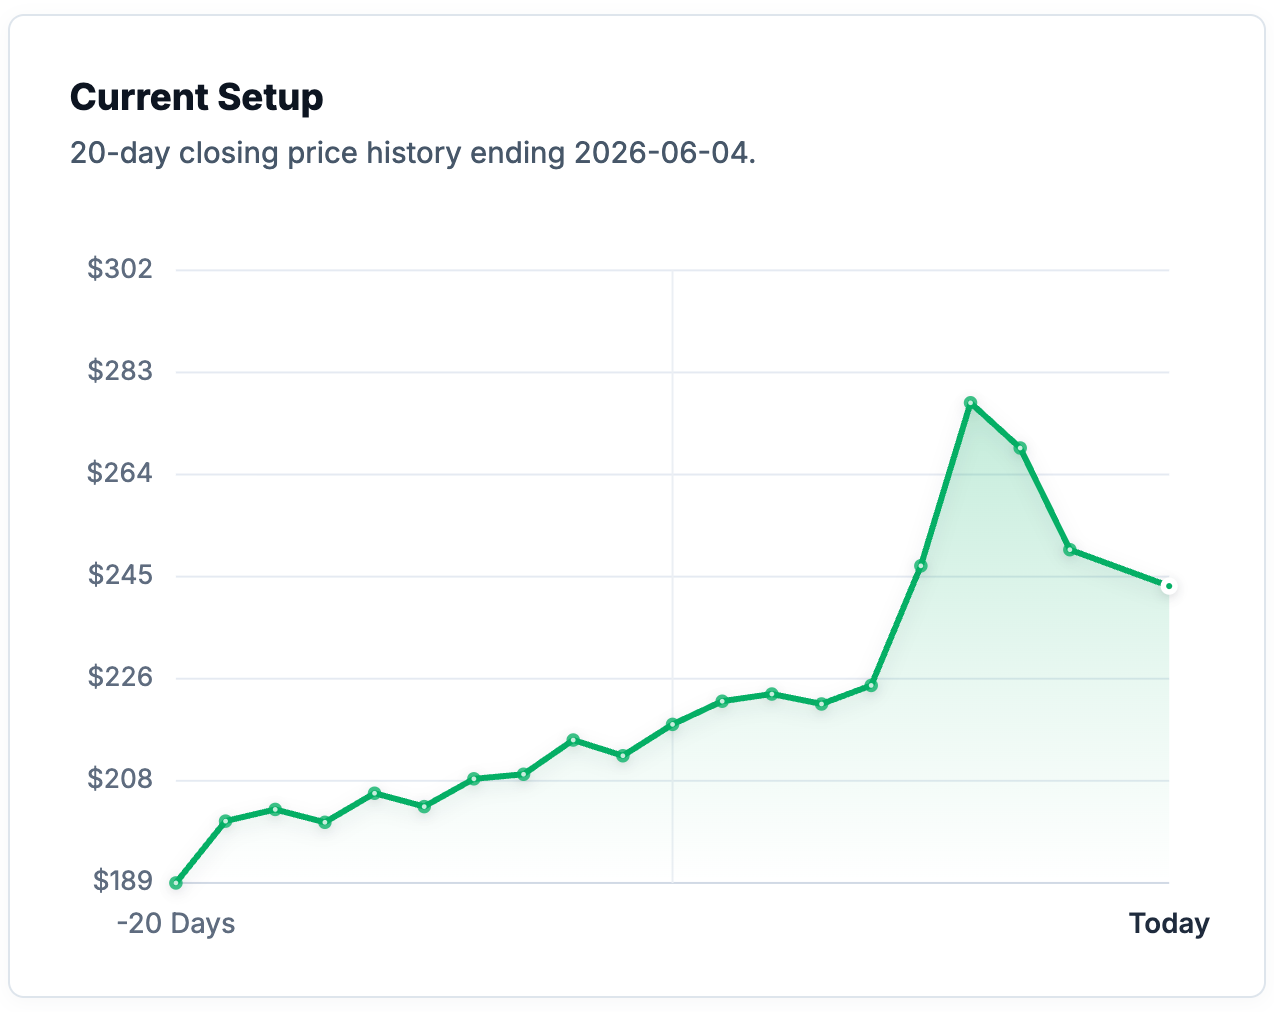
What EdgeAtlas Observed
EdgeAtlas identified a volatile Datadog setup involving a strong recent advance followed by a sharp short-term reversal. Similar historical market structures were found across a diversified set of prior stocks.
The historical evidence did not show a bullish or bearish advantage strong enough to rely on. Outcomes were mixed, with the positive-return rate below 50% and the central return slightly negative.
Traders should immediately understand that DDOG’s current setup is structurally recognizable, but historically it did not produce a clean forward edge.
Key Statistics
- Historical Matches: 65
- Positive Return Rate: 47.7%
- Average Return: -0.3%
- Median Return: -0.2%
- Worst Return: -13.0%
- Reliability: High
- Match Quality: Strong
The statistics suggest a mixed distribution rather than a directional setup. The historical evidence was useful and well-diversified, but the observed outcomes were not meaningfully positive.
Understanding The Metrics
Positive Return Rate measures the percentage of historical matches that produced a positive return over the 5-day forward window.
Match Quality measures how closely historical setups resembled the current market structure.
Reliability reflects the quantity, diversity, and consistency of the supporting historical evidence.
Why This Setup Is Interesting
DDOG is interesting precisely because the result is not bullish.
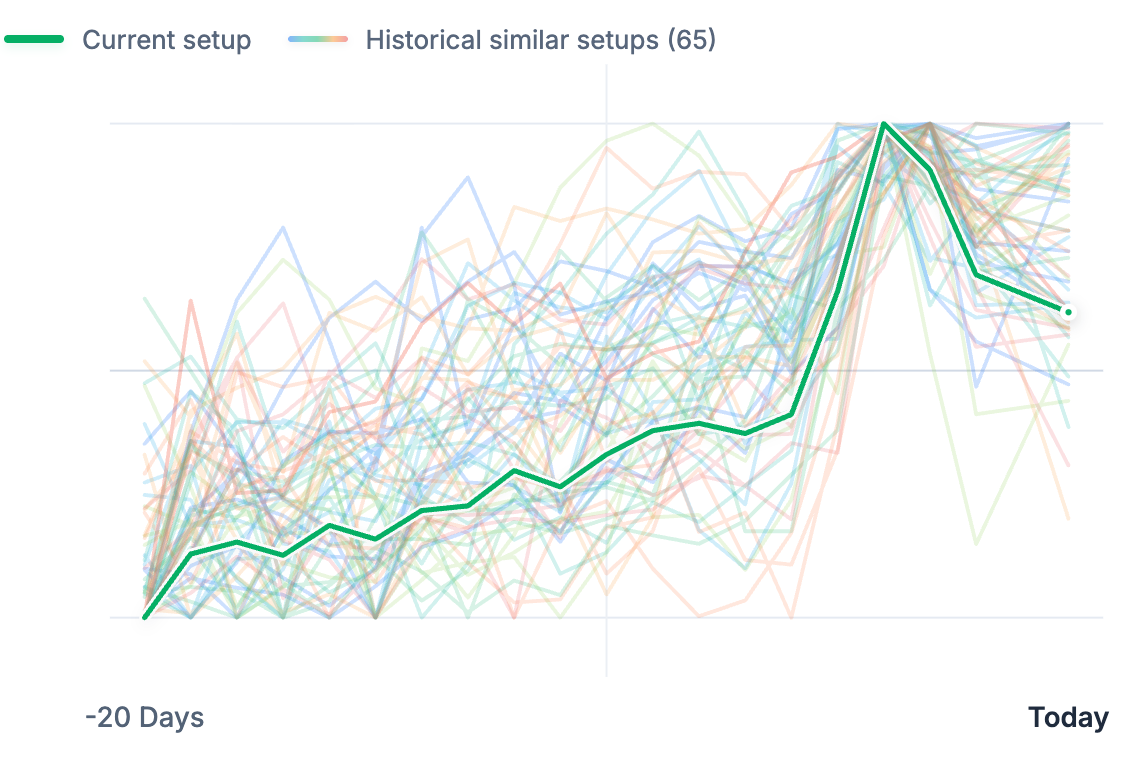
The setup had strong match quality and a reasonably large evidence base. That means the current structure was not random or hard to classify. EdgeAtlas found 65 historical analogs across 57 unique symbols.
But the forward outcomes were mixed. The positive-return rate was 47.7%, the average return was -0.3%, and the median return was -0.2%. That is a weak historical profile after similar setups.
This is a useful finding because traders often assume that a visually strong chart or a high-quality pattern match implies a directional edge. DDOG shows the opposite: a setup can be structurally clear but statistically unhelpful.
The downside tail also matters. The weakest historical case was -13.0%, which is large relative to the small central outcomes. When the center is flat and the tail is large, the setup deserves caution.
What An Experienced Trader Might Notice
- Strong match quality did not produce a positive historical edge.
- Average and median returns were both slightly negative, so the weakness was not only outlier-driven.
- The broad range was relatively balanced, but the extreme downside case was severe.
- DDOG is a good example of pattern recognition without favorable forward distribution.
Cross-Market Context
DDOG matched with historical setups from Western Digital, Akamai, Arista Networks, Hewlett Packard Enterprise, Coherent, Seagate, ResMed, Applied Materials, Gen Digital, lululemon, Chipotle, UnitedHealth, Ingersoll Rand, McKesson, Fair Isaac, Netflix, C.H. Robinson, Ulta Beauty, and LyondellBasell.
These matches span data storage, internet infrastructure, enterprise hardware, optical components, semiconductors, healthcare, cybersecurity, retail, restaurants, managed care, logistics, analytics, media, and chemicals.
This cross-market set is important because Datadog is a cloud software company, yet similar structures appeared across both growth and non-growth sectors. That suggests the pattern is less about software specifically and more about a broader market behavior: strong price advance, volatility expansion, and subsequent uncertainty.
Cross-market historical analysis is useful here because it prevents the interpretation from becoming too narrative-driven. The pattern has appeared in many unrelated contexts, and the forward behavior was mixed across them.
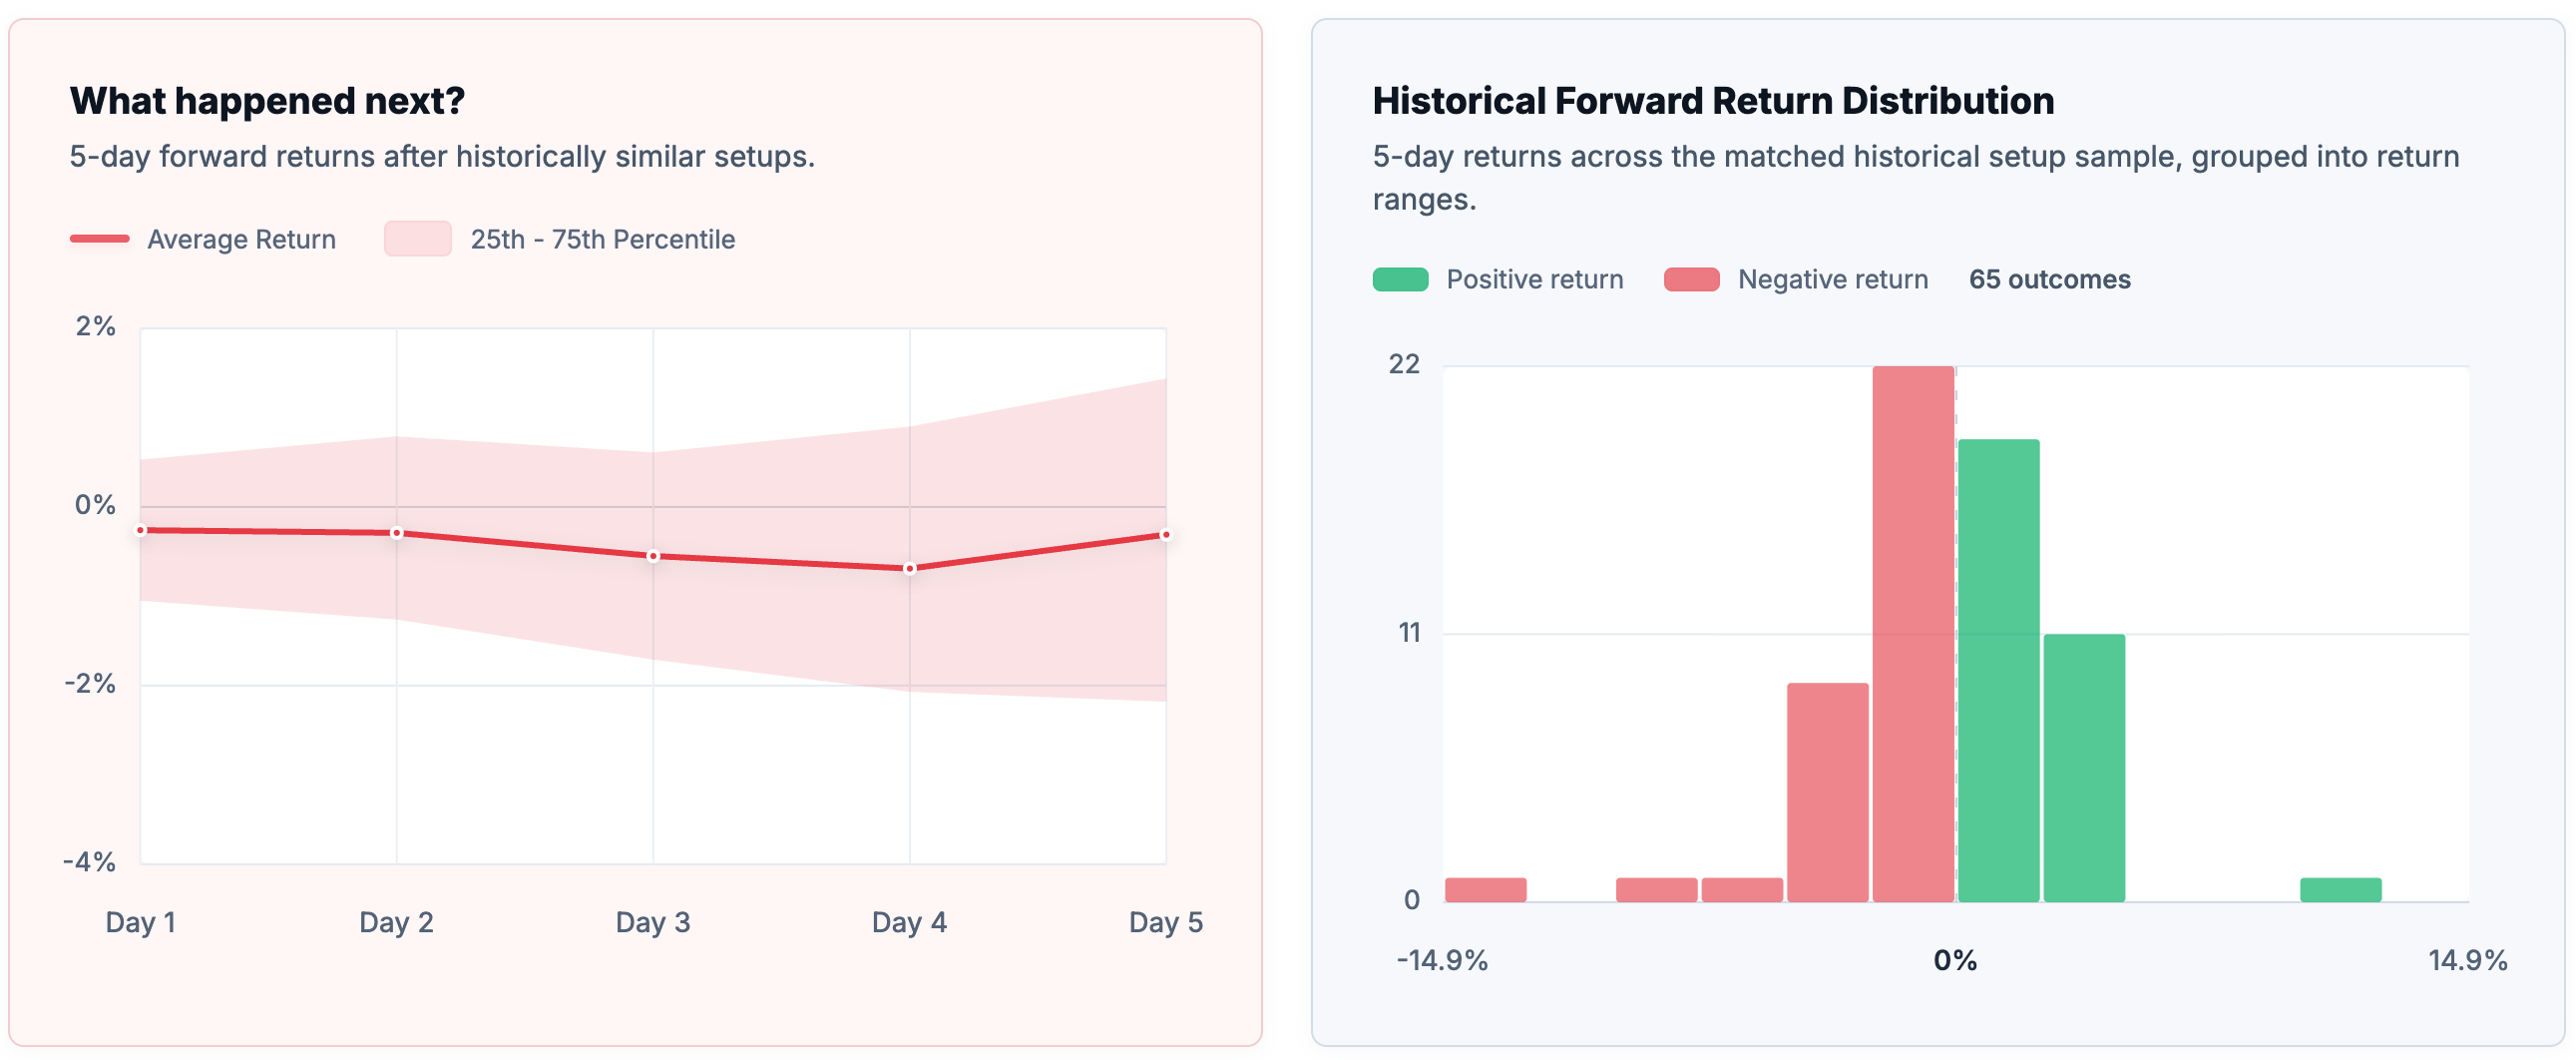
Historical Outcome Characteristics
The historical distribution was not constructive.
The 25th percentile was -2.2%, the median was -0.2%, and the 75th percentile was +1.4%. The broad 10th to 90th percentile range sat between roughly -3.7% and +2.9%.
That means many outcomes clustered around flat to mildly negative behavior. Upside cases existed, with a best case of +11.2%, but the downside tail was larger.
The worst historical 5-day return was -13.0%, and maximum adverse excursion reached -14.0%. With no clear positive center, this downside tail becomes more important in the interpretation.
Current Setup vs Historical Matches
Historical Outcome Distribution
Key Takeaways
- DDOG had mixed historical outcomes, not a clear directional edge.
- Similar setups finished positive only 47.7% of the time.
- Average and median returns were slightly negative.
- Downside tail risk was high, with a worst case of -13.0%.
- Cross-market matches appeared across many sectors, suggesting a broad behavioral pattern rather than a software-specific setup.
Frequently Asked Questions
What did EdgeAtlas find?
EdgeAtlas found that Datadog (DDOG) had a historically mixed setup based on similar 20-day market structures.
How many similar setups were found historically?
EdgeAtlas found 65 similar historical setups.
What were the typical historical outcomes?
Similar setups produced an average 5-day return of -0.3% and a median return of -0.2%.
What was the worst historical outcome?
The worst historical 5-day outcome was -13.0%.
Why were matches found in different stocks?
EdgeAtlas compares market structures across thousands of stocks. Similar behavior can appear across unrelated companies when price action, volatility, trend, and risk characteristics align.
How does EdgeAtlas identify similar setups?
EdgeAtlas compares the current 20-day setup against historical market structures using shape, trend, volatility, risk, volume, and positioning characteristics.
Does this predict future performance?
No. Historical similarity does not guarantee future outcomes. The analysis describes what happened after similar historical market conditions, not what will happen next.
Related Research Topics
- Mixed Historical Outcomes
- Cross-Market Analog Analysis
- Pattern Similarity vs Forward Edge
- Tail Risk After Volatile Advances
- Historical Outcome Distributions
Who May Find This Research Useful
This research may be useful for traders studying historical market behavior, investors researching DDOG stock analysis, analysts comparing historical market setups, and market participants interested in cross-market matches.
Methodology Note
EdgeAtlas does not forecast future prices.
Instead, it searches decades of market history across thousands of stocks to identify statistically similar market conditions and analyze what happened afterward.
The results presented here describe historical outcomes, not predictions.
EdgeAtlas compares the current market structure against decades of historical data across thousands of stocks. Rather than forecasting prices, it identifies statistically similar historical setups and examines how those situations behaved afterward.
Important Note
Historical outcomes do not guarantee future results.
This research is intended for educational and informational purposes only and should not be considered investment advice.