Executive Summary
- Norfolk Southern (NSC) showed a mild bullish historical skew.
- EdgeAtlas found 39 similar historical setups across 36 unique symbols.
- Similar setups finished positive 66.7% of the time over the next 5 trading days.
- Average return was +0.6%, while median return was +0.9%.
- The setup had relatively consistent historical outcomes but high downside tail risk.
- The most important observation is that the typical outcome was modest, while the worst outcome was unusually large.
Quick Answer
EdgeAtlas found that Norfolk Southern (NSC) had a mildly bullish historical setup on 2026-06-03. Similar 20-day market structures appeared 39 times historically and finished positive 66.7% of the time over the next 5 trading days.
The NSC stock analysis showed a modest positive historical tendency, with average return of +0.6% and median return of +0.9%. The center of the distribution was constructive but not especially large.
The key issue was downside tail risk. The worst historical outcome was -12.1%, which was far larger than the typical gain. This makes NSC the clearest tail-risk setup among the three.
What EdgeAtlas Observed
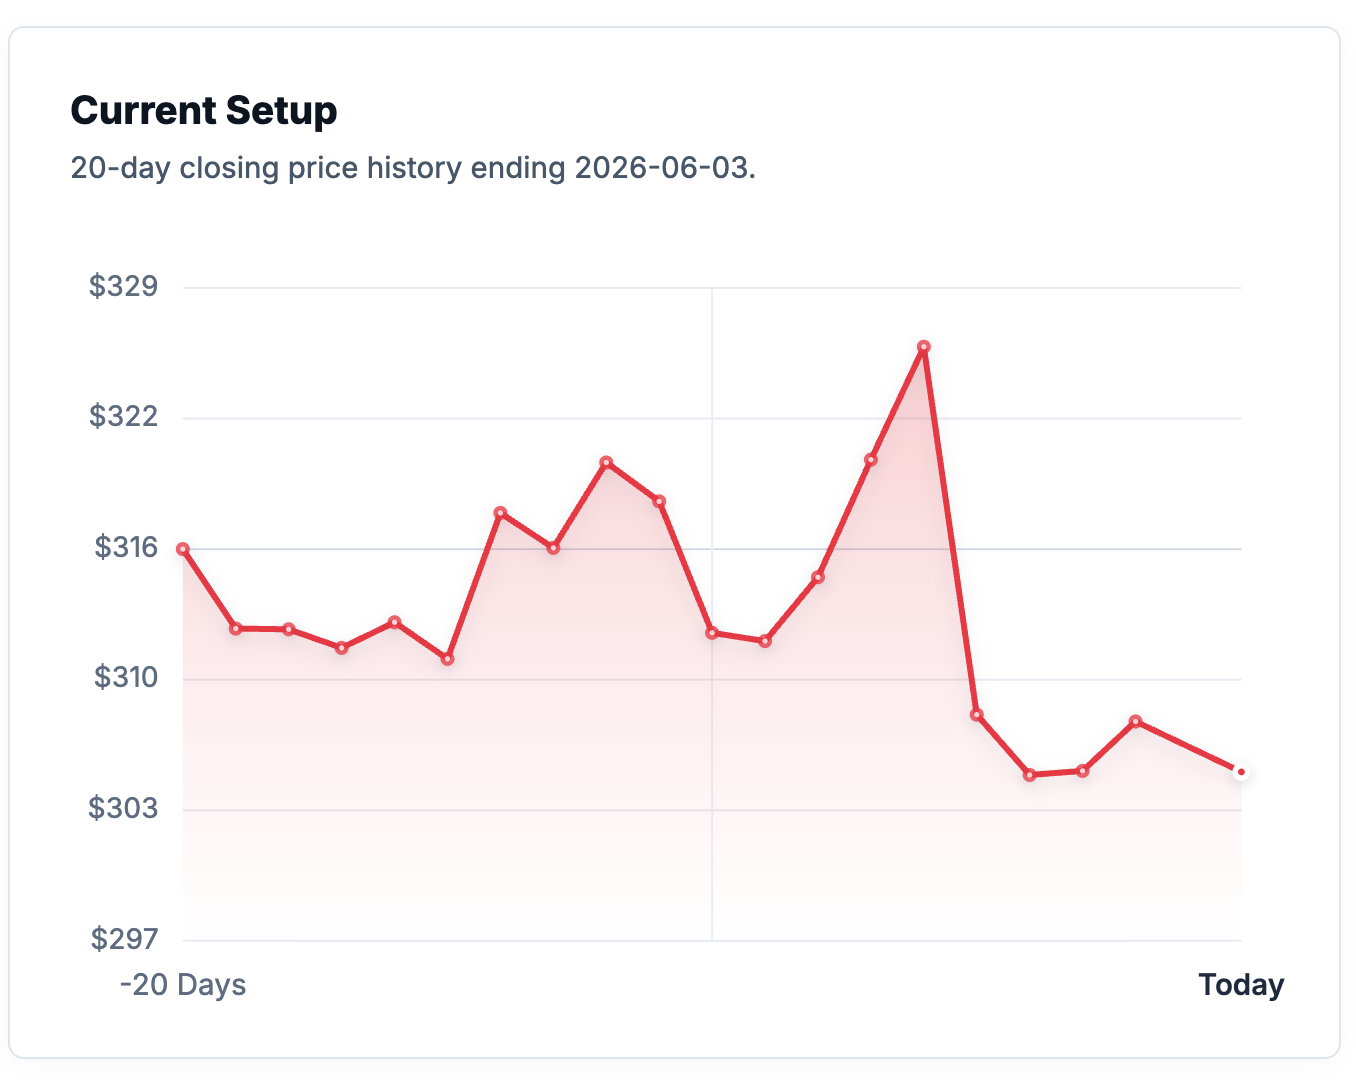
EdgeAtlas identified a 20-day structure in Norfolk Southern stock that historically leaned positive but not aggressively so.
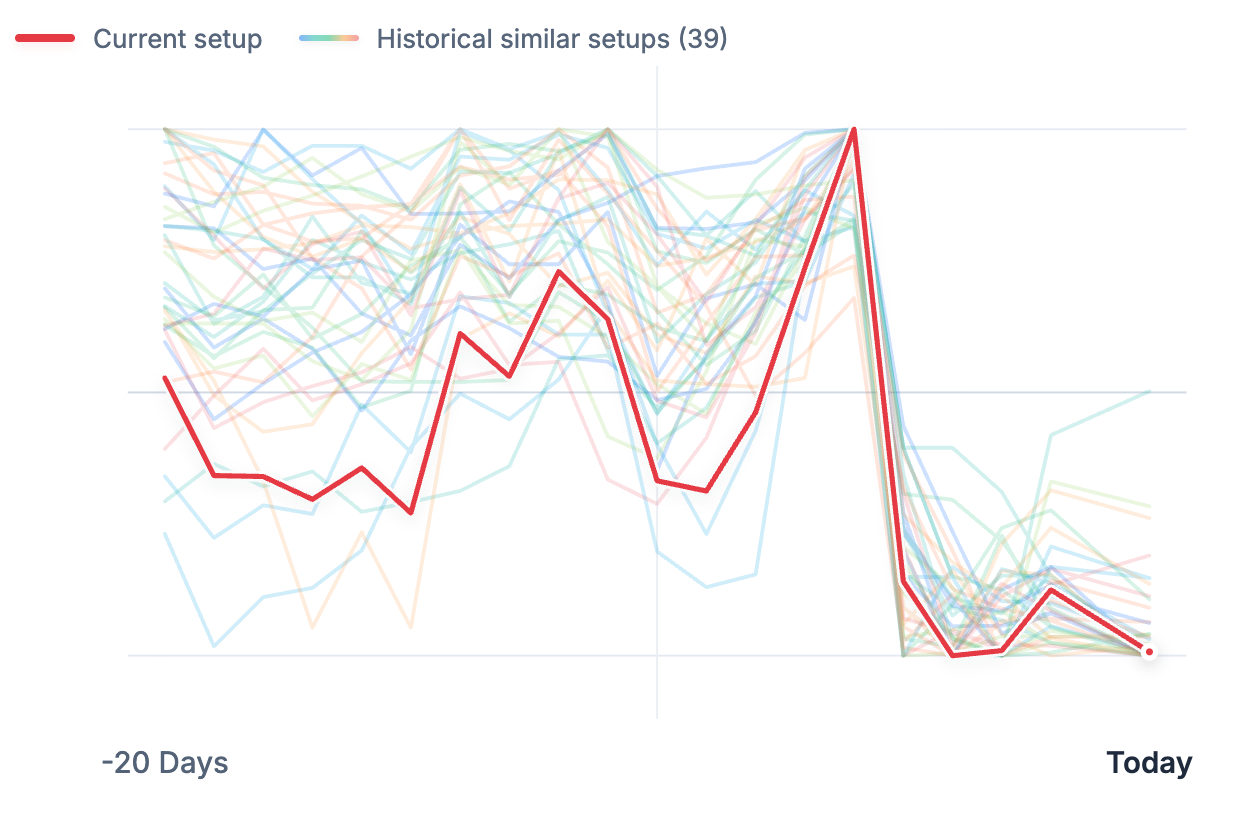
The setup had strong match quality and a reasonably diversified evidence base. Similar setups appeared across 36 unique symbols, suggesting the historical evidence was not concentrated in one stock.
The immediate lesson is that NSC had a positive historical tendency, but the payoff profile was modest and the downside exception was large.
Key Statistics
- Historical Matches: 39
- Positive Return Rate: 66.7%
- Average Return: +0.6%
- Median Return: +0.9%
- Worst Return: -12.1%
- Reliability: High
- Match Quality: Strong
The statistics show a mild bullish skew rather than a strong one. The median was higher than the average, suggesting the distribution was not upside-outlier driven. The major weakness was the severe worst-case outcome.
Understanding The Metrics
Positive Return Rate measures the percentage of historical matches that produced a positive return over the 5-day forward window.
Match Quality measures how closely historical setups resembled the current NSC market structure.
Reliability reflects the quantity, diversity, and consistency of the supporting historical evidence.
Why This Setup Is Interesting
NSC is interesting because the setup looked relatively consistent, but the tail risk was much larger than the typical reward.
The positive return rate was 66.7%, and the median return was +0.9%. That is constructive, but not powerful. The average return was only +0.6%, which reinforces the idea that the setup’s typical edge was modest.
The downside tail changes the interpretation. The worst historical outcome was -12.1%, which is extreme relative to the median gain. That kind of asymmetry matters.
This is the kind of setup where a simple bullish/bearish label is not enough. Historically, similar setups were more often positive than negative, but the left tail was large enough to dominate the risk conversation.
For traders, the non-obvious point is that consistency does not automatically mean attractive risk/reward. A setup can be right more often than wrong and still carry unfavorable adverse exceptions.
What An Experienced Trader Might Notice
- The median was higher than the average, which suggests weaker outcomes pulled the mean down.
- The setup had relatively consistent historical behavior, but the payoff was modest.
- The worst historical case was far larger than the normal positive outcome.
- NSC is more useful as a risk-awareness example than as a simple bullish setup.
Cross-Market Context
NSC matched with historical setups from Keysight Technologies, Molson Coors, Nike, Verisign, Ford, Hartford Insurance, Ecolab, Jacobs Solutions, Pentair, W.W. Grainger, Danaher, and Verisk Analytics.
These matches came from industrial technology, beverages, consumer brands, infrastructure services, insurance, chemicals, distribution, healthcare tools, and analytics.
That cross-market mix is meaningful because NSC is a railroad company, yet the strongest historical analogs were not concentrated in transportation. Similar structures appeared across many industries.
This suggests the setup may reflect a broader market behavior pattern: post-decline stabilization with mild positive follow-through, but occasional sharp downside failure.
That is exactly where cross-market analysis becomes useful. It shows that the same type of market structure can emerge across unrelated business models.
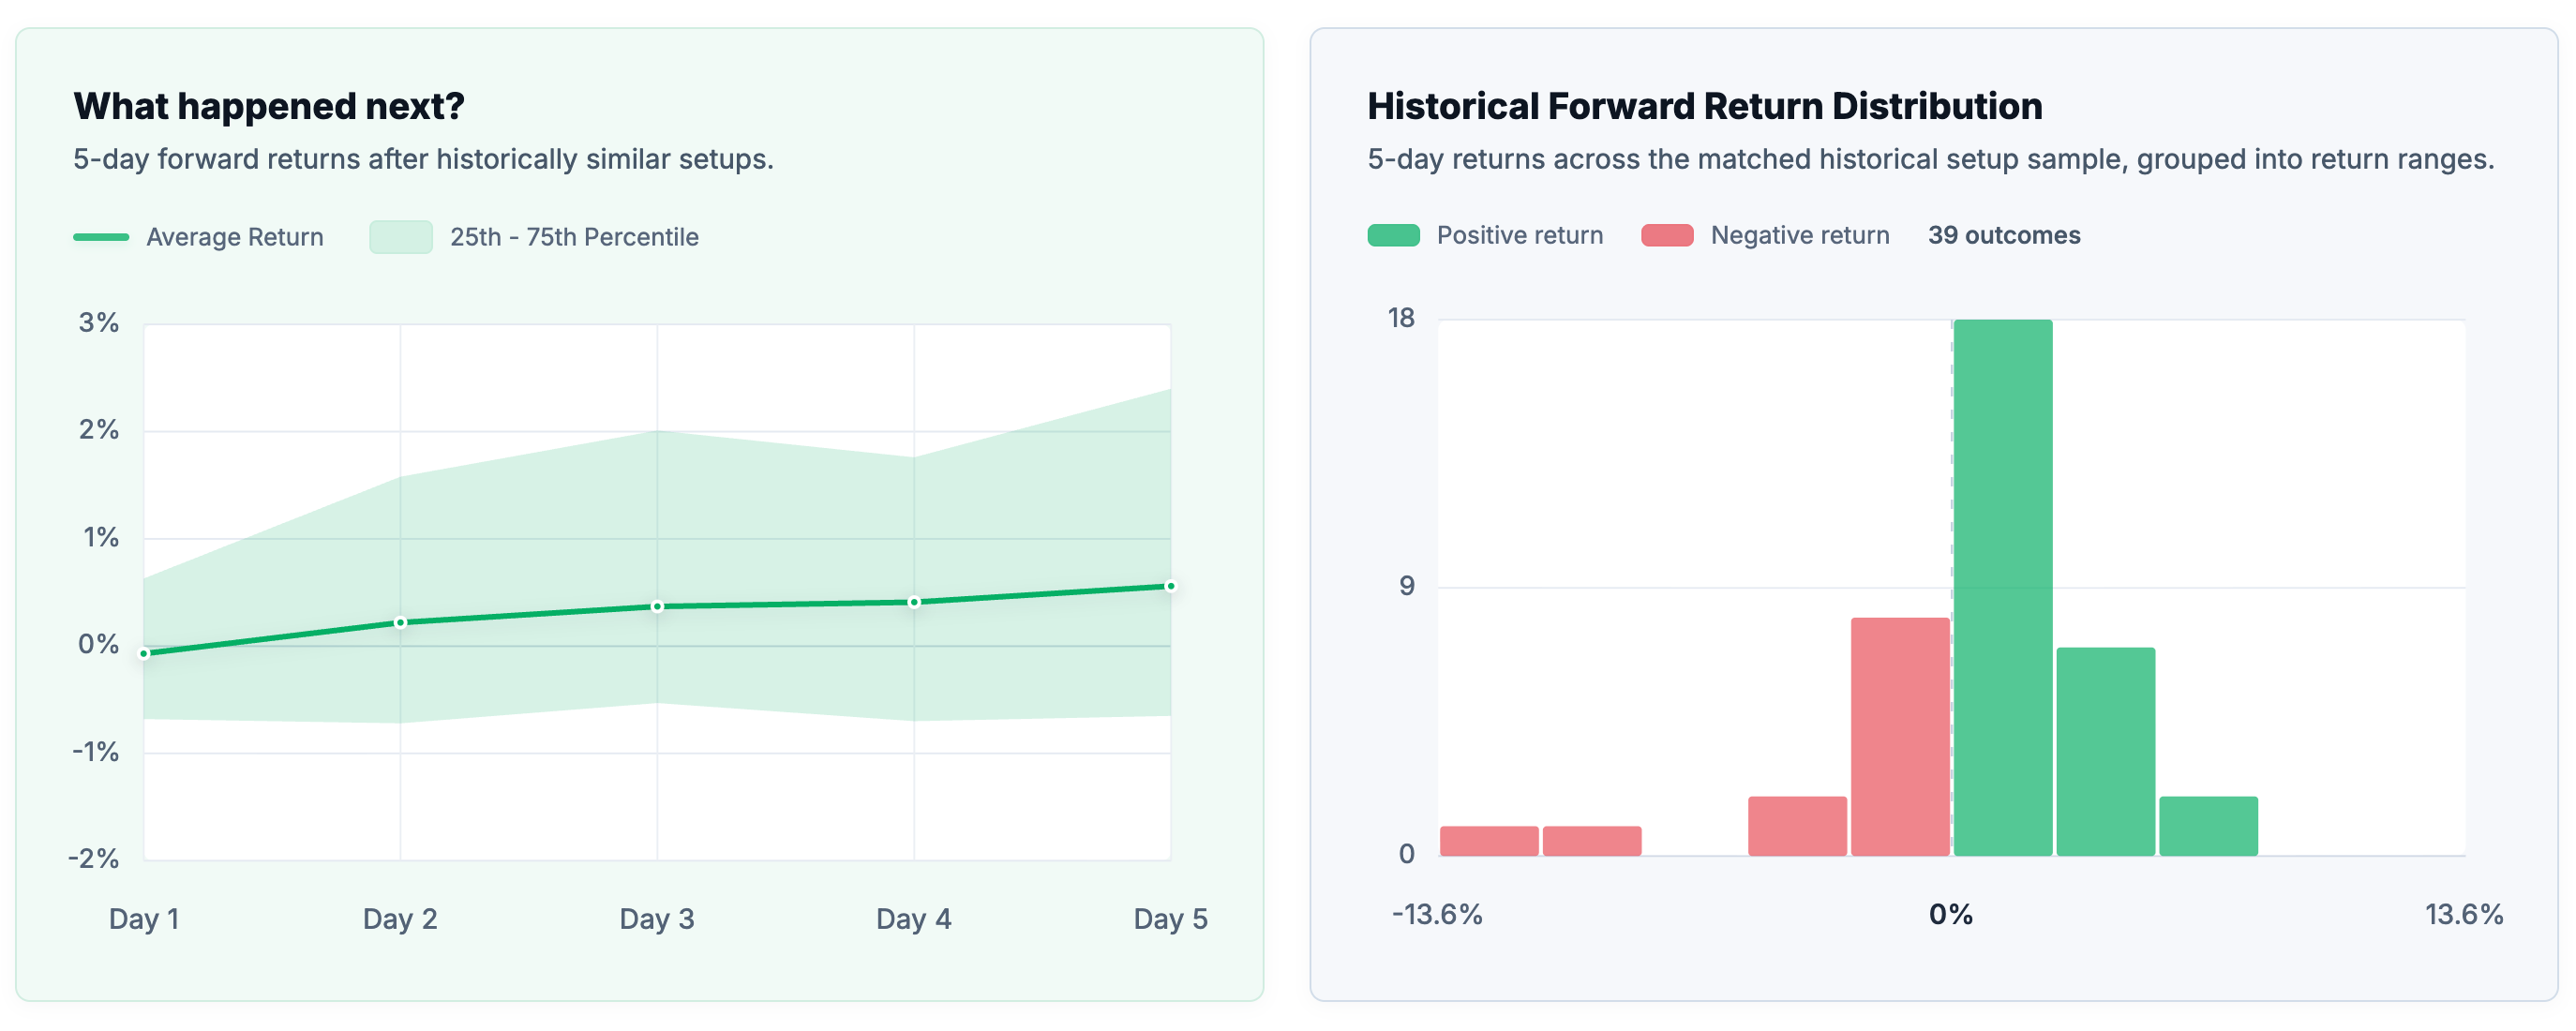
Historical Outcome Characteristics
The historical distribution was moderately constructive but not especially strong.
The 25th percentile was -0.7%, the median was +0.9%, and the 75th percentile was +2.4%. The broad 10th to 90th percentile range sat between -1.5% and +3.2%.
That range suggests many outcomes clustered near the center. However, the worst historical 5-day outcome was -12.1%, and maximum adverse excursion reached -12.7%.
This makes NSC a useful example of mild positive skew with large downside exceptions. The setup had historical evidence, but the risk/reward balance was less attractive than the positive return rate alone suggests.
Current Setup vs Historical Matches
Historical Outcome Distribution
Key Takeaways
- NSC had a mild bullish historical tendency.
- Similar setups finished positive 66.7% of the time.
- The typical outcome was modest, with a median return of +0.9%.
- The worst historical case was severe at -12.1%.
- Cross-market matches showed similar structures across many unrelated sectors.
Frequently Asked Questions
What did EdgeAtlas find?
EdgeAtlas found that Norfolk Southern (NSC) had a mildly bullish historical setup based on similar 20-day market structures.
How many similar setups were found historically?
EdgeAtlas found 39 similar historical setups across 36 unique symbols.
What were the typical historical outcomes?
Similar setups produced an average 5-day return of +0.6% and a median 5-day return of +0.9%.
What was the worst historical outcome?
The worst historical 5-day outcome was -12.1%.
Why were matches found in different stocks?
EdgeAtlas compares market structures across thousands of stocks because similar price behavior can appear across unrelated sectors when trend, volatility, risk, and positioning conditions are similar.
How does EdgeAtlas identify similar setups?
EdgeAtlas compares the current 20-day market structure against historical setups using shape, trend, volatility, risk, volume, and range-position features.
Does this predict future performance?
No. Historical similarity does not guarantee future outcomes. The analysis describes what happened after similar historical market conditions, not what will happen next.
Related Research Topics
- Mild Bullish Historical Skew
- Tail Risk in Modest Positive Setups
- Cross-Market Analog Analysis
- Reliability vs Risk/Reward
- Historical Outcome Distributions
Who May Find This Research Useful
This research may be useful for traders studying NSC stock analysis, investors researching Norfolk Southern stock, analysts reviewing historical market patterns, and market participants interested in cross-market matches.
Methodology Note
EdgeAtlas does not forecast future prices.
Instead, it searches decades of market history across thousands of stocks to identify statistically similar market conditions and analyze what happened afterward.
The results presented here describe historical outcomes, not predictions.
EdgeAtlas compares the current market structure against decades of historical data across thousands of stocks. Rather than forecasting prices, it identifies statistically similar historical setups and examines how those situations behaved afterward.
Important Note
Historical outcomes do not guarantee future results.
This research is intended for educational and informational purposes only and should not be considered investment advice.