Executive Summary
- Cisco Systems (CSCO) showed a moderately bullish historical setup after a strong 20-day move.
- EdgeAtlas found 29 similar historical setups across 29 unique symbols.
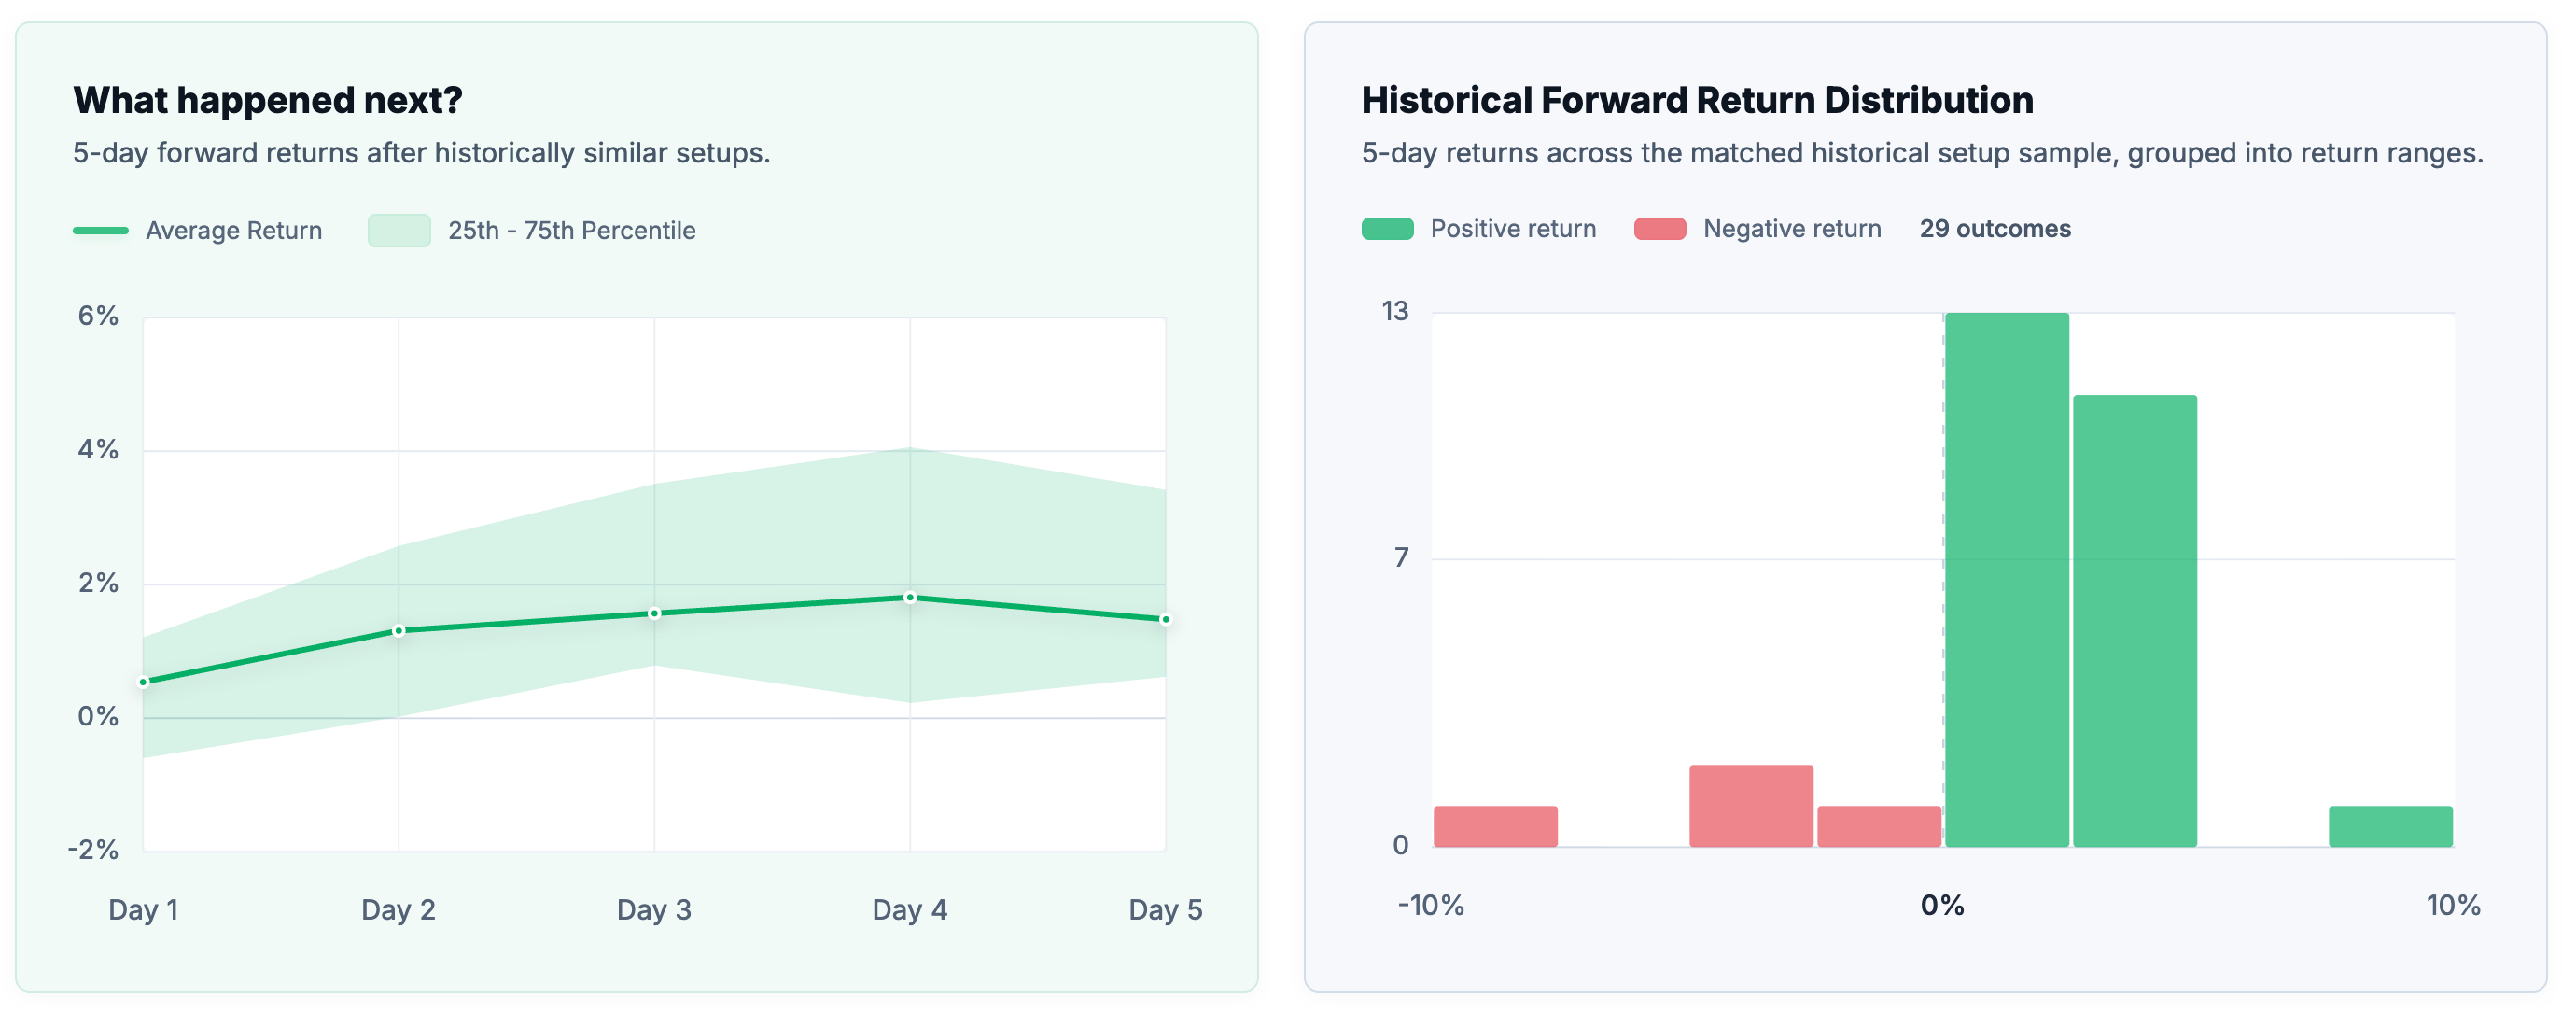
- Similar setups finished positive 86.2% of the time over the next 5 trading days.
- Average return was +1.5%, while median return was +1.6%.
- The key limitation is sample size: the evidence was useful but not definitive.
- The most important observation is the contrast between very high win rate and still meaningful downside tail risk.
Quick Answer
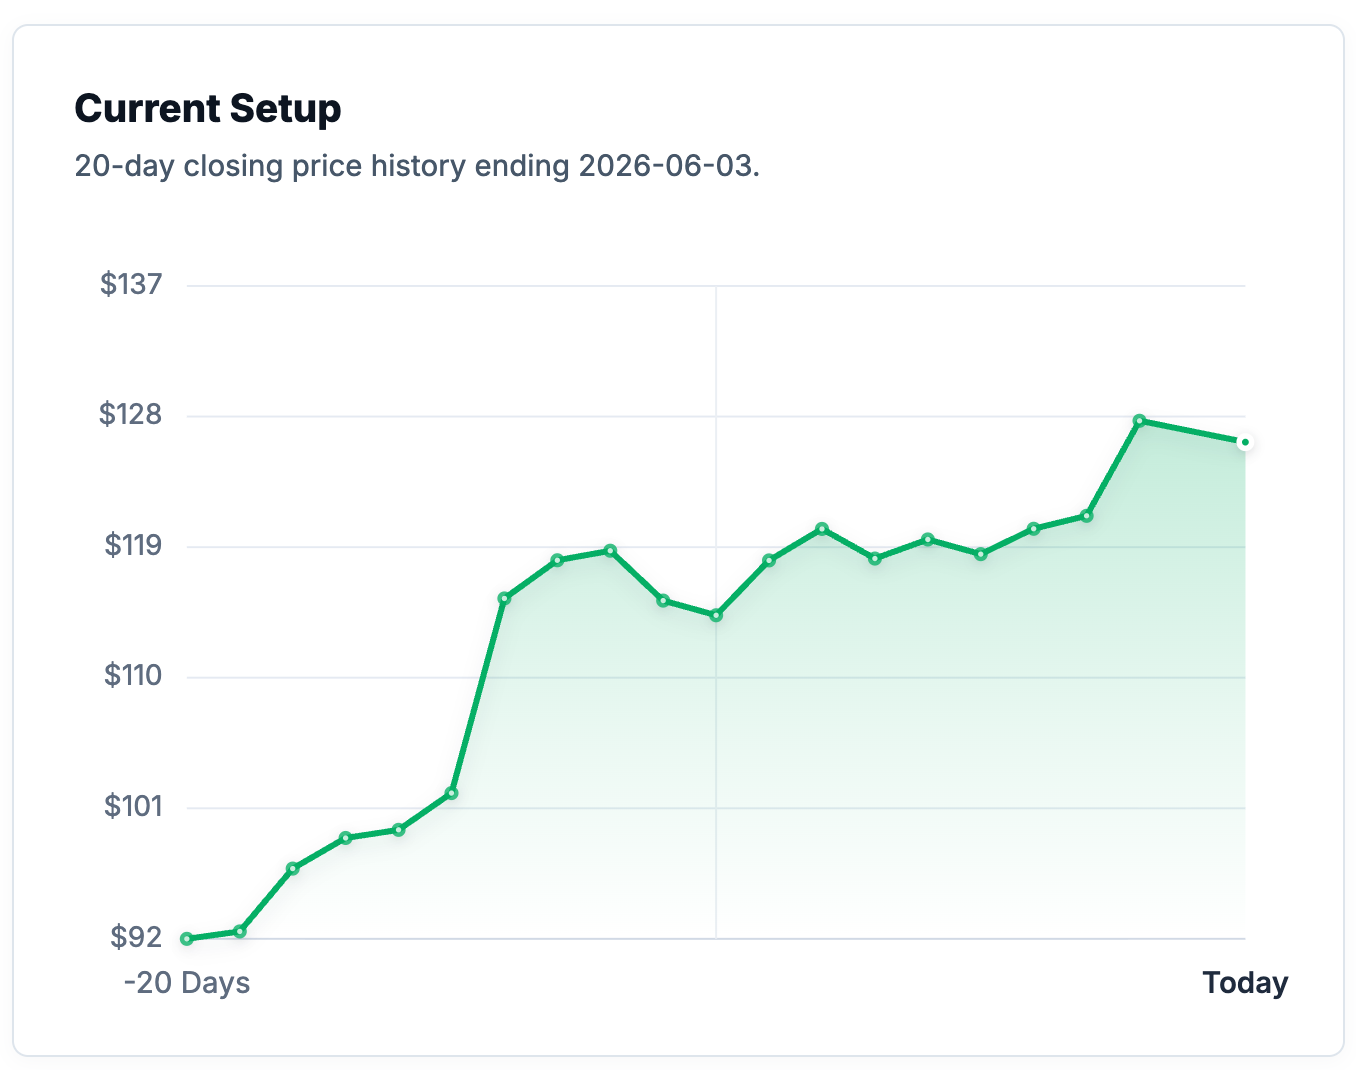
EdgeAtlas found that Cisco Systems (CSCO) had a historically positive setup on 2026-06-03. Similar 20-day structures appeared 29 times historically and finished positive 86.2% of the time over the next 5 trading days.
The CSCO stock analysis showed a clean central tendency, with average return of +1.5% and median return of +1.6%. That alignment suggests the historical result was not mainly driven by a few extreme winners.
However, the evidence base was smaller than CDNS and NSC. The setup also had high downside tail risk, with the weakest prior case falling -8.7%.
What EdgeAtlas Observed
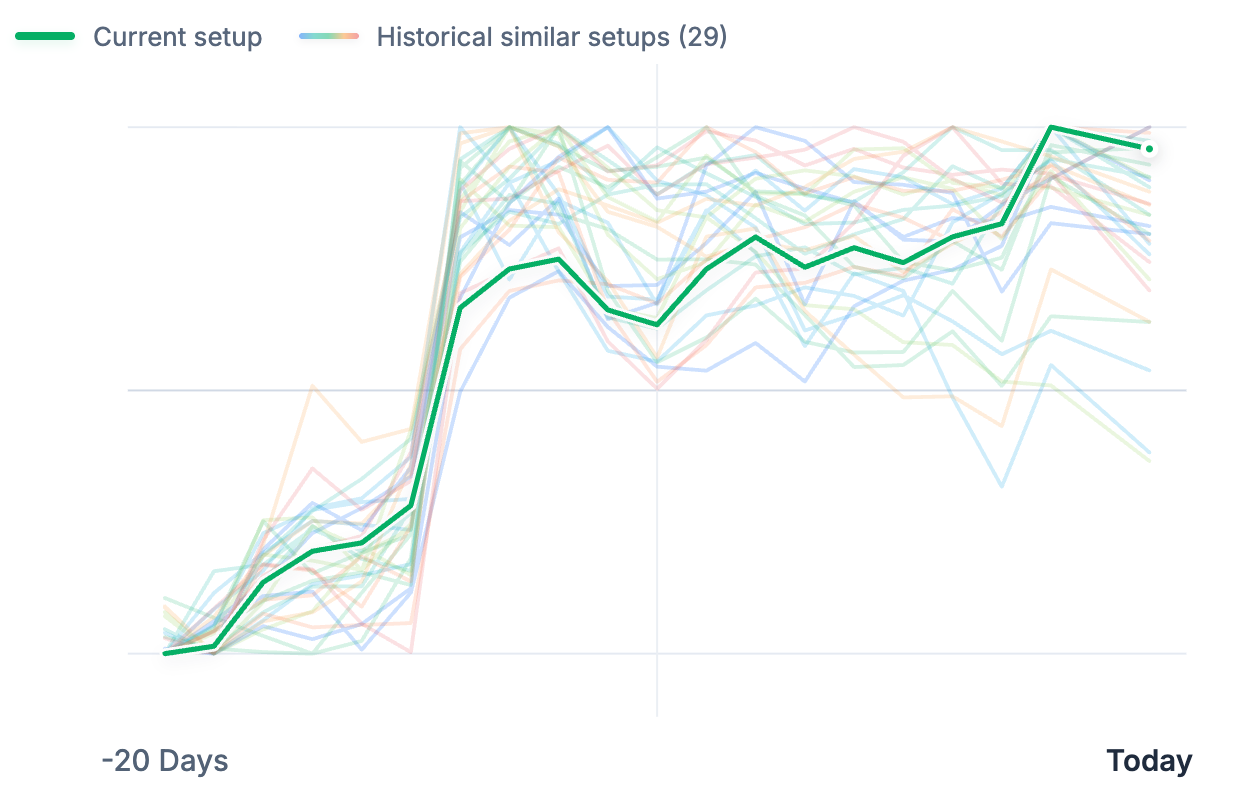
EdgeAtlas identified a strong upward structure in Cisco Systems stock after a notable recent repricing. The system found 29 similar historical setups across a fully diversified set of unique symbols.
The historical outcomes leaned positive, and the positive return rate was unusually high. However, the sample size was not large enough to treat the result as definitive.
The immediate takeaway is that CSCO had a high historical hit rate, but the risk profile was not as clean as the win rate alone might imply.
Key Statistics
- Historical Matches: 29
- Positive Return Rate: 86.2%
- Average Return: +1.5%
- Median Return: +1.6%
- Worst Return: -8.7%
- Reliability: Moderate
- Match Quality: Strong
The positive return rate was very high, and the average and median were closely aligned. That is encouraging from a distribution standpoint. The weakness is that the evidence count was only 29, and the worst case was severe relative to the typical gain.
Understanding The Metrics
Positive Return Rate measures the percentage of historical matches that produced a positive return over the 5-day forward window.
Match Quality measures how closely historical setups resembled the current CSCO market structure.
Reliability reflects the quantity, diversity, and consistency of the supporting historical evidence.
Why This Setup Is Interesting
CSCO is interesting because the win rate is very strong, but the reliability rating is only moderate.
An 86.2% positive return rate is the highest among the three setups reviewed today. The average and median returns were also aligned, which suggests the historical profile was not obviously distorted by one or two extreme upside cases.
That is the hidden strength.
The weakness is evidence depth. Twenty-nine matches is useful, but it is not a large sample. A high positive return rate on a smaller sample should be treated more carefully than the same rate on hundreds of cases.
The second weakness is tail risk. The worst historical 5-day outcome was -8.7%, far larger than the median gain of +1.6%. This creates an asymmetry problem: the usual historical case was constructive, but the adverse historical exception was large.
This is a setup where the headline win rate looks excellent, but the deeper interpretation is more balanced.
What An Experienced Trader Might Notice
- Average and median returns were almost identical, which makes the central tendency cleaner.
- The high win rate is impressive, but the evidence count is only 29.
- The worst case was large enough to challenge the usefulness of win rate alone.
- This setup is a good example of why reliability and tail risk should be read together.
Cross-Market Context
CSCO matched with historical setups from West Pharmaceutical Services, United Rentals, Target, Broadcom, Teledyne, TransDigm, Global Payments, Workday, Netflix, Micron, CDW, and American Express.
These matches came from healthcare suppliers, industrial equipment, retail, semiconductors, aerospace, payments, software, media, and financial services.
The cross-market mix is important because CSCO is a networking technology company, yet its closest historical analogs were not limited to networking or enterprise hardware. EdgeAtlas found similar market structures across very different types of businesses.
That suggests the pattern may reflect broader market behavior after strong repricing events, not only Cisco-specific fundamentals.
Historical Outcome Characteristics
The historical distribution had a constructive center.
The 25th percentile was +0.6%, the median was +1.6%, and the 75th percentile was +3.4%. That means even the lower-middle portion of the historical distribution was positive.
The broad 10th to 90th percentile range ran from -1.2% to +3.9%, which looks relatively contained. But the worst historical outcome was -8.7%, and maximum adverse excursion reached -11.7%.
This is the key tension: most historical outcomes were positive, but rare downside cases were severe.
Current Setup vs Historical Matches
Historical Outcome Distribution
Key Takeaways
- CSCO had the highest positive return rate among the three reviewed setups.
- Average and median returns were closely aligned, suggesting a cleaner central tendency.
- The evidence base was useful but smaller than the others.
- Downside tail risk was significant despite the high historical win rate.
- Cross-market matches appeared across technology, industrials, retail, healthcare, and financial services.
Frequently Asked Questions
What did EdgeAtlas find?
EdgeAtlas found that Cisco Systems (CSCO) had a historically positive setup based on similar 20-day market structures.
How many similar setups were found historically?
EdgeAtlas found 29 similar historical setups across 29 unique symbols.
What were the typical historical outcomes?
Similar setups produced an average 5-day return of +1.5% and a median 5-day return of +1.6%.
What was the worst historical outcome?
The worst historical 5-day outcome was -8.7%.
Why were matches found in different stocks?
EdgeAtlas searches across many stocks because similar market structures can appear in different sectors when trend, volatility, positioning, and risk behavior align.
How does EdgeAtlas identify similar setups?
EdgeAtlas compares the current 20-day structure against historical setups using shape, trend, volatility, risk, volume, and range-position characteristics.
Does this predict future performance?
No. Historical similarity does not guarantee future outcomes. The analysis describes what happened after similar historical market conditions, not what will happen next.
Related Research Topics
- Win Rate vs Reliability
- Tail Risk in High-Probability Setups
- Cross-Market Pattern Matching
- Historical Outcome Distributions
- Post-Repricing Market Structures
Who May Find This Research Useful
This research may be useful for traders studying CSCO stock analysis, investors researching Cisco Systems stock, analysts comparing historical stock analysis, and market participants interested in cross-market analysis.
Methodology Note
EdgeAtlas does not forecast future prices.
Instead, it searches decades of market history across thousands of stocks to identify statistically similar market conditions and analyze what happened afterward.
The results presented here describe historical outcomes, not predictions.
EdgeAtlas compares the current market structure against decades of historical data across thousands of stocks. Rather than forecasting prices, it identifies statistically similar historical setups and examines how those situations behaved afterward.
Important Note
Historical outcomes do not guarantee future results.
This research is intended for educational and informational purposes only and should not be considered investment advice.