Executive Summary
- Cadence Design Systems (CDNS) showed a strong bullish historical skew after a sharp 20-day advance.
- EdgeAtlas found 49 similar historical setups across 48 unique symbols.
- Similar setups finished positive 69.4% of the time over the next 5 trading days.
- Average return was +2.4%, while median return was +1.9%.
- The main risk was downside tail exposure, with the worst historical outcome at -6.0%.
- The most important observation is that the setup leaned positive, but the historical path was not risk-free.
Quick Answer
EdgeAtlas found that Cadence Design Systems (CDNS) had a historically constructive setup on 2026-06-03. Similar 20-day market structures appeared 49 times historically and finished positive 69.4% of the time over the next 5 trading days.
The CDNS stock analysis showed a strong bullish historical tendency, supported by strong match quality and a diversified evidence base. However, the setup also carried elevated downside tail risk, with the weakest prior occurrence falling -6.0%.
This makes the setup historically positive, but not cleanly one-sided. The key lesson is that strong historical skew can still coexist with meaningful short-term risk.
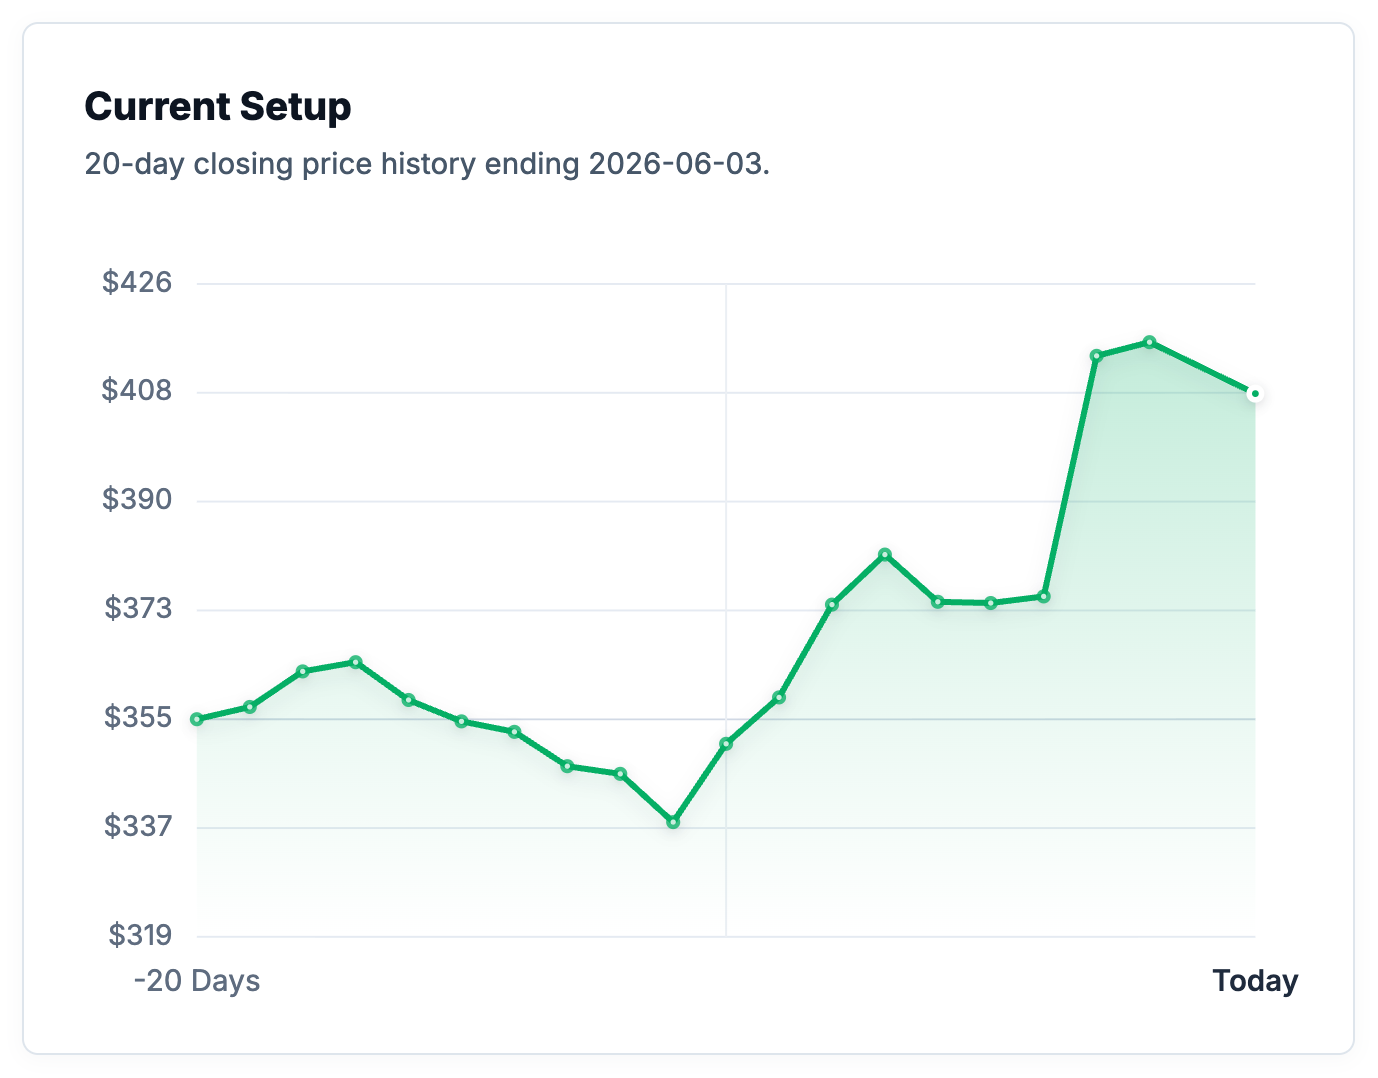
What EdgeAtlas Observed
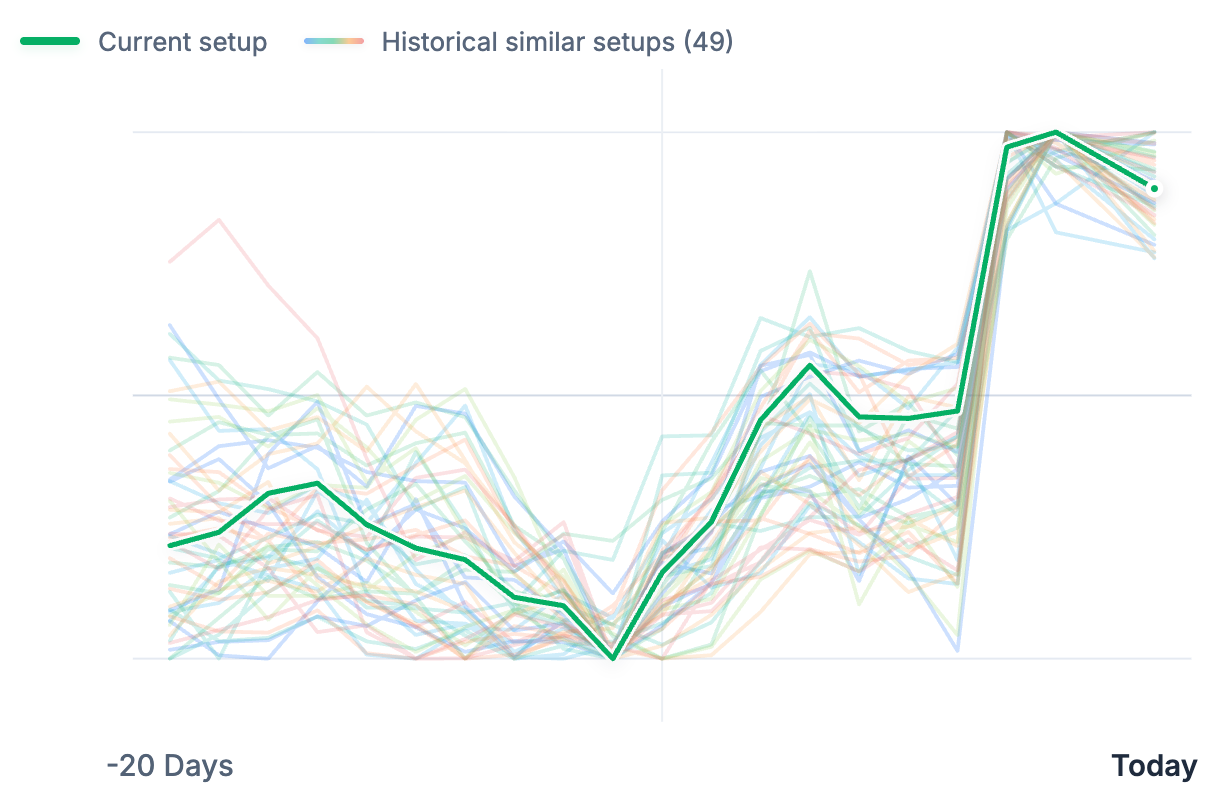
EdgeAtlas identified a sharp upward structure in Cadence Design Systems stock after a strong recent advance. The system matched this current 20-day structure against historical market patterns across other stocks.
The historical evidence showed a positive tendency. Similar setups were often followed by further upside over the next 5 trading days, with both average and median returns clearly positive.
What traders should immediately understand is that this was one of the stronger bullish setups among the three reviewed today, but the downside tail remained large enough to matter.
Key Statistics
- Historical Matches: 49
- Positive Return Rate: 69.4%
- Average Return: +2.4%
- Median Return: +1.9%
- Worst Return: -6.0%
- Reliability: High
- Match Quality: Strong
The statistics suggest a constructive historical profile. The average and median were both positive, and the positive return rate was meaningfully above 50%. However, the worst historical outcome shows that similar setups occasionally reversed sharply.
Understanding The Metrics
Positive Return Rate measures the percentage of historical matches that produced a positive return over the 5-day forward window.
Match Quality measures how closely historical setups resembled the current CDNS market structure.
Reliability reflects the quantity, diversity, and consistency of the supporting historical evidence.
Why This Setup Is Interesting
CDNS is interesting because it combines strong upside tendency with non-trivial risk.
The headline statistics look constructive: nearly 69% of similar setups finished positive, and the median outcome was close to +1.9%. That is stronger than a weak or marginal pattern.
The more important detail is the shape of the distribution. The broad historical outcome range sat between roughly -2.9% and +6.4%, while the worst case reached -6.0%. This means the setup had a favorable center, but the left tail was still active.
That matters because strong bullish skew can create a false sense of safety. The historical evidence suggests similar setups often followed through, but not always smoothly.
The cross-market evidence was also useful. Similar structures appeared in industrials, energy-related names, solar, retail, travel, insurance, healthcare tools, and technology-adjacent businesses. That suggests the pattern was not only a semiconductor software story. It was a broader market behavior pattern: strong repricing followed by short-term continuation in many prior cases.
What An Experienced Trader Might Notice
- The median return was positive, so the setup was not purely driven by a few extreme winners.
- The upside distribution was broad enough to support the bullish skew, but the left tail was still meaningful.
- The evidence base was diversified across 48 unique symbols, which improves the usefulness of the historical context.
- The setup looks constructive, but the risk profile argues against treating it as a clean momentum continuation.
Cross-Market Context
CDNS matched with a wide set of unrelated historical analogs, including Lennox International, Texas Pacific Land, First Solar, Dollar Tree, Allegion, Loews, Booking Holdings, Travelers, Revvity, Costco, A. O. Smith, and Emerson Electric.
These matches came from industrials, retail, energy-linked assets, insurance, travel, healthcare tools, and consumer businesses.
That range matters. It suggests EdgeAtlas was not simply matching CDNS against other technology or semiconductor names. The system was identifying a broader behavioral structure that has appeared across different business models.
This is one reason cross-market historical analysis can be useful. Similar price behavior can emerge across unrelated stocks when market participants react to comparable trend, volatility, positioning, or repricing conditions.
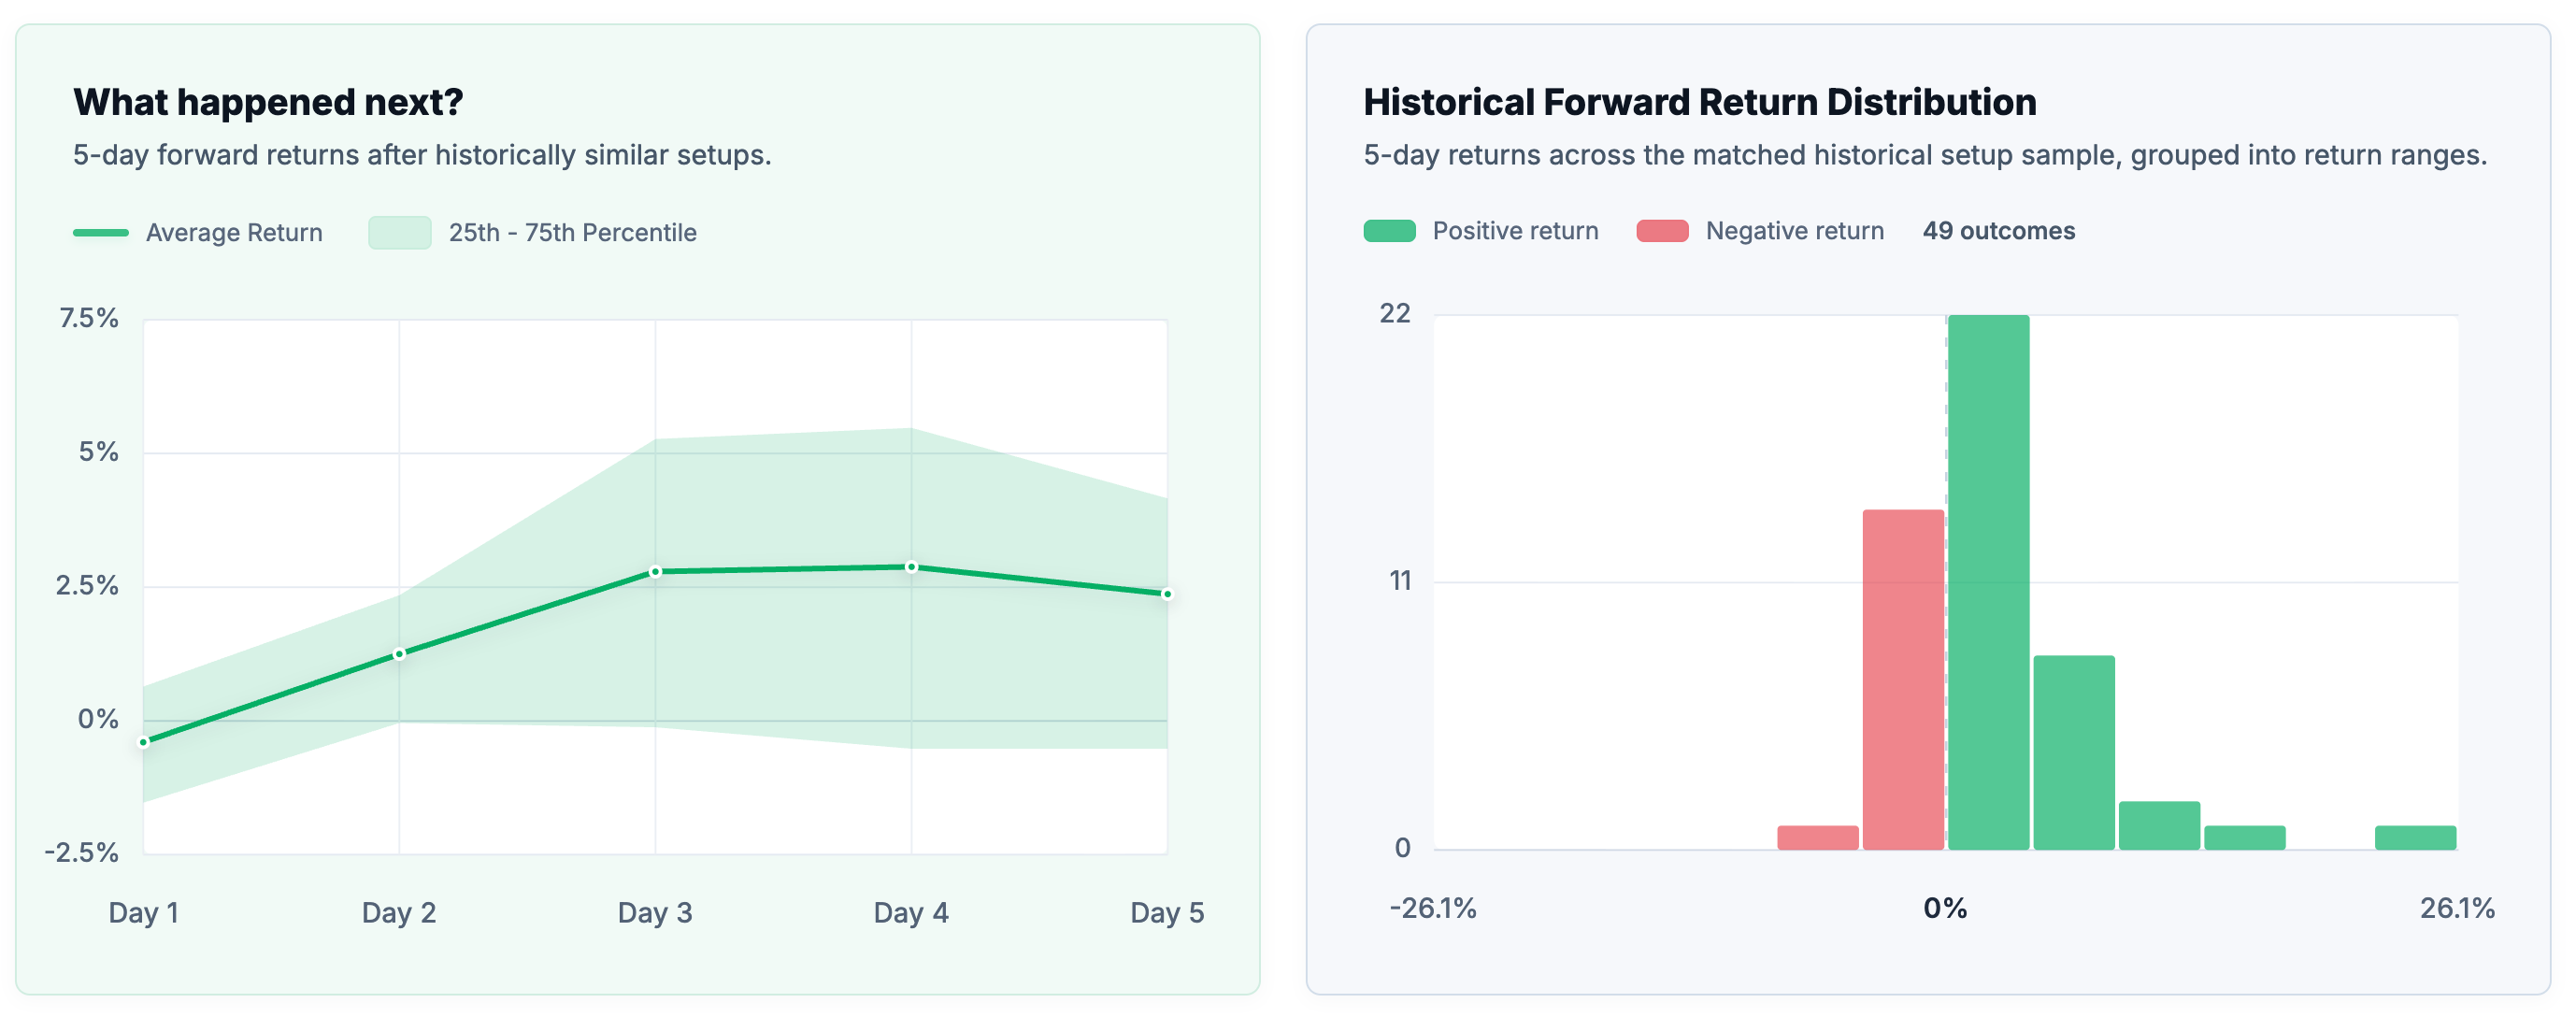
Historical Outcome Characteristics
The historical outcomes were moderately consistent and skewed positive.
The 25th percentile was slightly negative at -0.5%, while the median was +1.9% and the 75th percentile was +4.2%. The 90th percentile reached +6.4%, showing that upside continuation was meaningful in stronger cases.
The downside tail was the main limitation. The worst historical 5-day return was -6.0%, and maximum adverse excursion reached -10.3%.
Overall, CDNS had the strongest positive historical tendency among the three setups, but the setup still required risk awareness.
Current Setup vs Historical Matches
Historical Outcome Distribution
Key Takeaways
- CDNS had a strong bullish historical skew.
- Similar setups finished positive 69.4% of the time over 5 trading days.
- Average and median returns were both positive, suggesting the setup was not purely outlier-driven.
- Cross-market matches appeared across many unrelated sectors.
- Downside tail risk remained meaningful despite the constructive historical tendency.
Frequently Asked Questions
What did EdgeAtlas find?
EdgeAtlas found that Cadence Design Systems (CDNS) had a historically constructive setup based on similar 20-day market structures.
How many similar setups were found historically?
EdgeAtlas found 49 similar historical setups across 48 unique symbols.
What were the typical historical outcomes?
Similar setups produced an average 5-day return of +2.4% and a median 5-day return of +1.9%.
What was the worst historical outcome?
The worst historical 5-day outcome was -6.0%.
Why were matches found in different stocks?
EdgeAtlas compares market structures across thousands of stocks. Similar behavior can appear across unrelated companies when price action, volatility, trend, and risk characteristics align.
How does EdgeAtlas identify similar setups?
EdgeAtlas compares the current 20-day market structure against historical market patterns and evaluates similarity across shape, trend, volatility, risk, volume, and positioning.
Does this predict future performance?
No. Historical similarity does not guarantee future outcomes. The analysis describes what happened after similar historical market conditions, not what will happen next.
Related Research Topics
- Strong Bullish Historical Skew
- Cross-Market Analog Analysis
- Historical Outcome Distributions
- Momentum Continuation After Repricing
- Tail Risk in Positive Setups
Who May Find This Research Useful
This research may be useful for traders studying CDNS stock analysis, investors researching Cadence Design Systems stock, analysts comparing historical market setups, and market participants interested in cross-market matches.
Methodology Note
EdgeAtlas does not forecast future prices.
Instead, it searches decades of market history across thousands of stocks to identify statistically similar market conditions and analyze what happened afterward.
The results presented here describe historical outcomes, not predictions.
EdgeAtlas compares the current market structure against decades of historical data across thousands of stocks. Rather than forecasting prices, it identifies statistically similar historical setups and examines how those situations behaved afterward.
Important Note
Historical outcomes do not guarantee future results.
This research is intended for educational and informational purposes only and should not be considered investment advice.